response for the 26-min tidal period runs (Run 4, for example) was much less than
that of the 105-min period of Run 8, because the shorter duration could not pro-
vide enough time to fill as much of the bay for the relatively similar geometric
conditions of the inlet for both tests. The smaller amount of bay filling created
significantly different hydraulic conditions, especially with regard to time for peak
flows. For the longer tide period, maximum currents occurred near midtide ocean
elevations, whereas for the 26-min tide, maximum ebb and flood currents oc-
curred near times of low and high tide elevations, respectively. As a result, the
two tidal wave periods provide significantly different hydraulic conditions for
creation of the minimum-inlet area response.
Inlet morphology
An interesting and surprising result is no significant change in channel mor-
phology for extremely different hydraulic conditions (compare Figure 10a (Run 8)
to Figure 11b (Run 9) for tide-current-only conditions). The inlet shoulders are
nearly parallel as channel width increases to an equilibrium condition. It must be
remembered that there is no significant ebb shoal that might influence flow pat-
terns for currents at different tide stages. After waves are added, the oceanward
portion widens and the narrowest part of the inlet migrates bayward. The lack of
littoral input from adjacent beaches may have an influence on this shape.
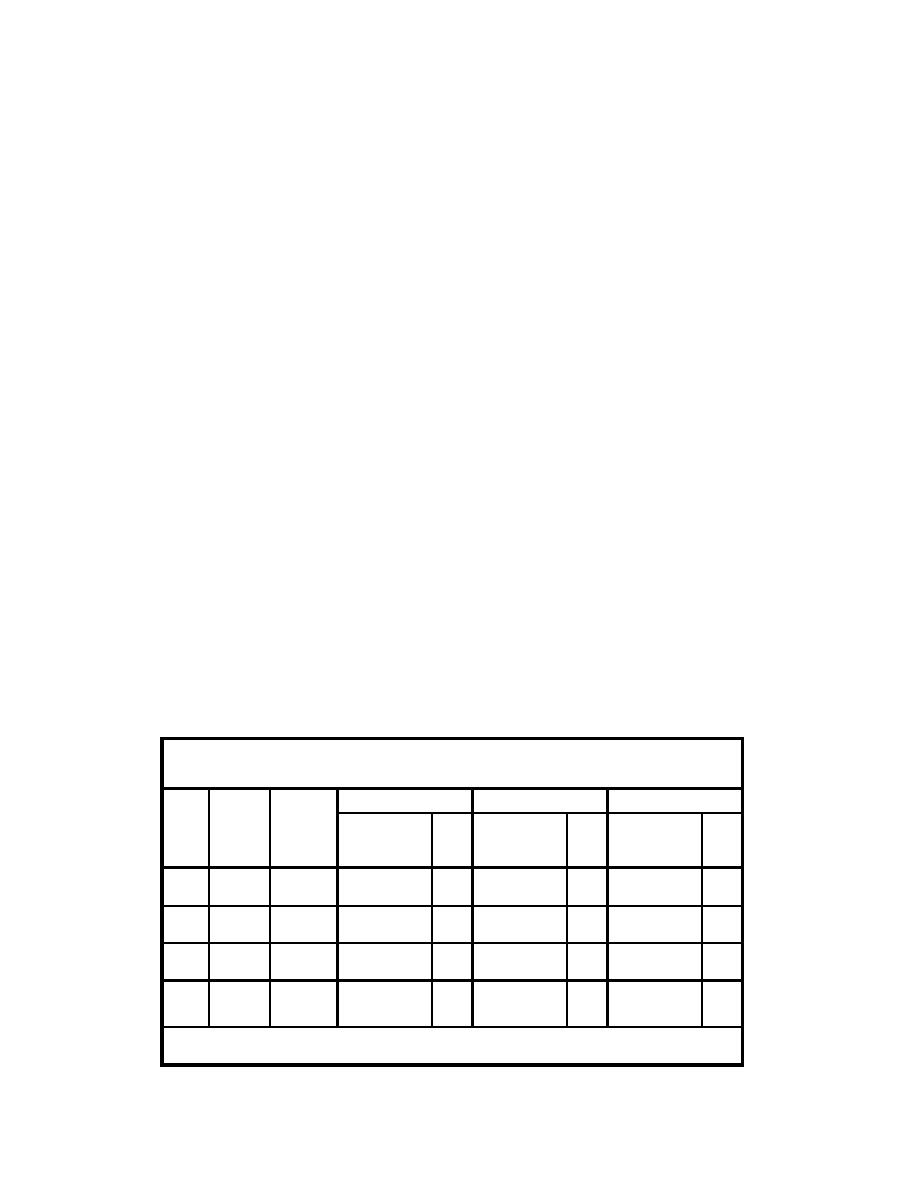
Table 3 shows channel width, average depth, minimum cross-section area,
and channel aspect ratio (AR = width/depth at minimum width) for the pre-
experiment, post-experiment without waves, and post-experiment with waves
conditions. It should be noted that Run 4 was initially a wider, shallower inlet
than the others. A comparison of Runs 5 and 8 with regard to sediment size (be-
cause tide period is common to both, 105 min) shows that the smaller sediment
size developed a larger equilibrium area for both nonwave and wave areas. This
result is similar to the inlet laboratory study of Delmonte and Johnson (1971)
where median diameter sands of 0.52 and 0.30 mm were used. Their study
Table 3
Widths, Depths, Areas, and Aspect Ratios for Runs 4, 5, 8, and 9
Pre-experiment
Post-tide
Post-tide and Waves
Median
Sand
Tide
Width, Depth,
Width, Depth,
Width, Depth,
Run
Period
Size,
and Area
and Area
and Area
mm
No.
min
ft, ft 2
ft, ft 2
ft, ft 2
AR
AR
AR
3.1, 0.145,
3.8, 0.15,
7.6, 0.09,
4
26
0.13
0.45
22
0.569
25
0.652
88
2.15, 0.26,
4.25, 0.29,
5.7, 0.28,
5
105
0.13
0.567
8
1.249
15
1.589
20
2.3, 0.29,
4.5, 0.19,
5.3, 0.18,
8
105
0.26
0.663
8
0.875
24
0.942
29
--
2.2, 0.26,
5.5, 0.25,
9
26
0.26
0.561
9
1.347
22
--
--
Note: To convert width and depth to meters, multiply by 0.3048. To convert area to square meters, multi-
ply by 0.0929.
20
Chapter 4 Experiments and Results


 Previous Page
