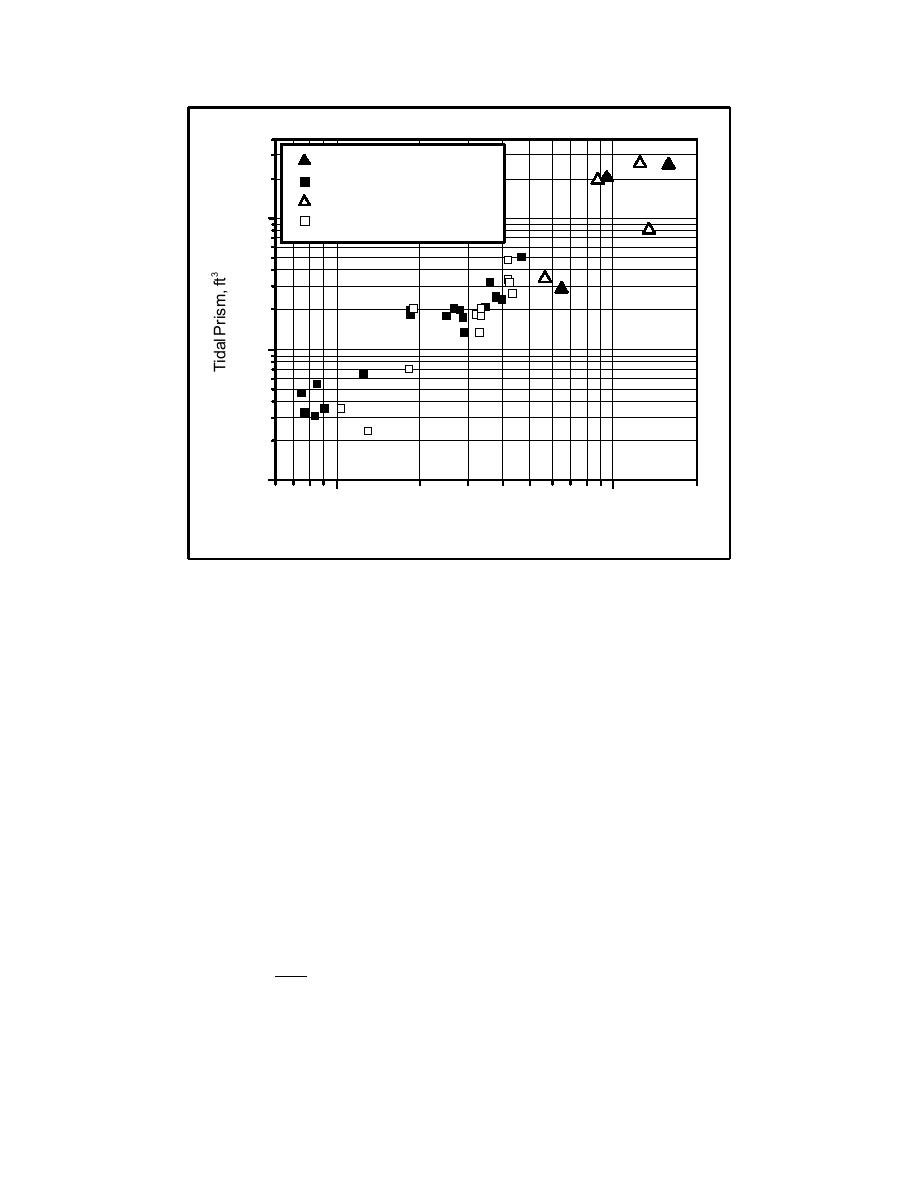
CIRP w/waves
Mayor-Mora w/waves
CIRP no waves
1000
Mayor-Mora no waves
100
10
0.1
1
2
Minimum Cross-section Area, ft
Figure 16. Laboratory data for tidal prism versus minimum cross-section area for
tide-only and tide-plus-wave conditions. (To convert area to square
meters, multiply by 0.0929. To convert prism volume to cubic meters,
multiply by 0.0283)
Data from this study and others presented earlier indicate that Equation 2
shows good agreement with inlet data over a wide range of size scales. This could
be considered surprising in light of the simplified assumptions made in deriving
Equation 2 as discussed in Chapter 1. In other words, many inlets apparently fit
the simplified assumptions of the derivation. Also the modeling performed in this
study was distorted from larger inlets in the sense that maximum currents for equi-
librium are much less than those found in the field inlets. These were only at the
lower end of a decreasing progression of equilibrium velocities, i.e., thinking in
terms that these inlets were small "real" inlets, not scale-model inlets. However,
thinking in terms of a model, the inlets were considered undistorted models and
the aspect ratios of Table 3 were reasonable to inlets of much larger dimension,
indicating no real distortion of geomorphology. Currents were distorted in that
sense that when using a flow equation such as Manning's, the current is weaker
because of the much smaller depth:
1.49 2/3 1/2
V=
(6)
R S
n
25
Chapter 4 Experiments and Results


 Previous Page
