

7
10
6
10
105
104
3
10
Line of perfect fit
2
10
1
10
0
10
-1
10
-2
10
-2
-1
0
1
2
3
4
5
6
7
10
10
10
10
10
10
10
10
10
10
2
Calculated Area, (π*P / T*Um ), ft
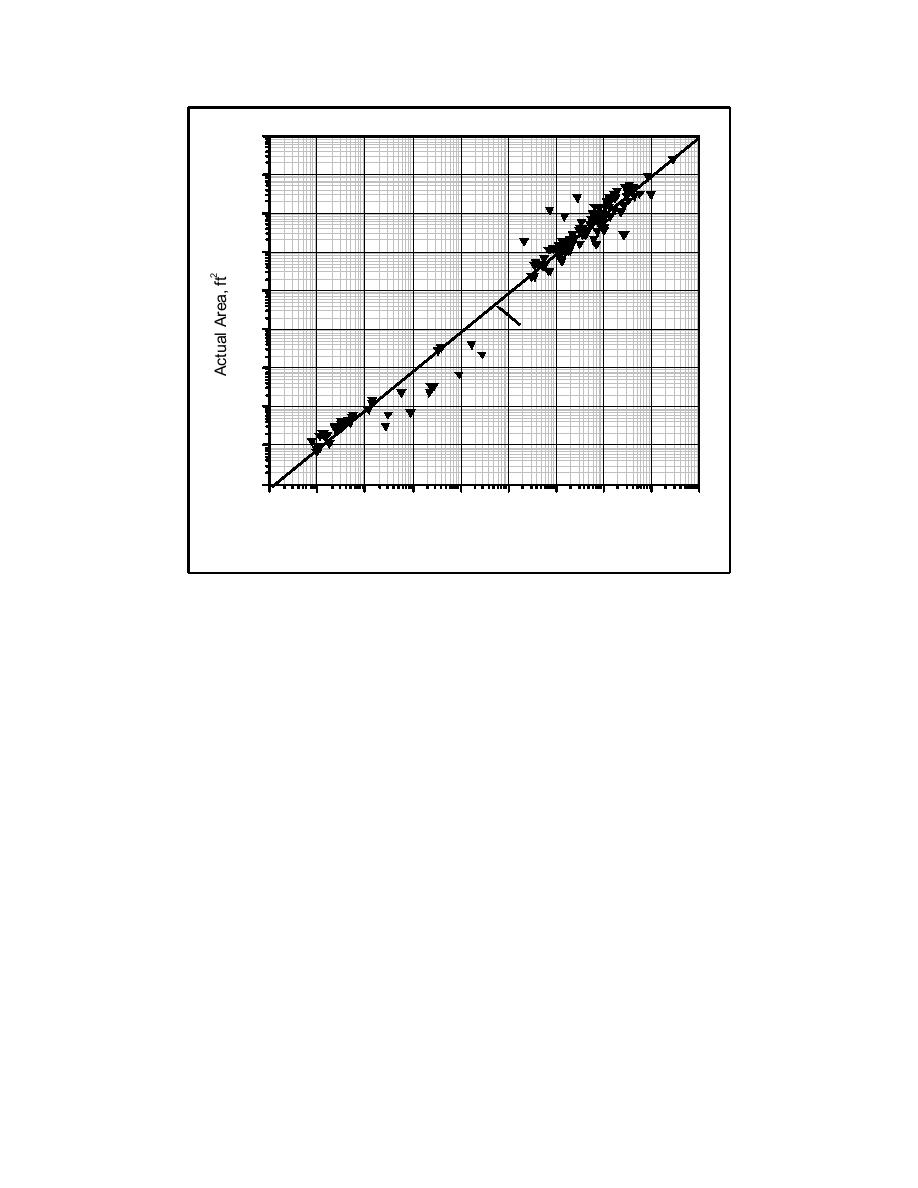
Figure 14. Actual versus calculated area for tidal prism minimum equilibrium area
relationship of this report (to convert areas to square meters, multiply by
0.0929)
The larger than equilibrium cross sections would result in weaker measured
channel velocities and a larger calculated area as seen in Figure 14, because the
velocity value is in the denominator of the expression for area. If the velocity
measurement had been taken during the actual channel enlarging event, the data
point would have been more likely to fall on the agreement line.
For relatively simple inlets, the area calculated by Equation 2 provides a good
estimate of the equilibrium area, as noted by the good comparison of actual areas
versus calculated area for the laboratory inlets that are truly in equilibrium (the
field inlets are always in a state of flux, so a given data set from the field may not
represent an equilibrium inlet).
The standard plot of tidal prism versus area is presented in Figure 15, show-
ing data from the field (Jarrett 1976; Byrne, Gammisch, and Thomas 1980) and
the laboratory (Mayor-Mora (1977) and this study). The laboratory data fall be-
low a typical prism versus area relationship of Jarrett plotted with the field data.
The relationship of Jarrett (1976), O'Brien (1931, 1969), Johnson (1972), and
others has been based on the data sets of relatively large inlets. The smaller field
inlet data set of Byrne, Gammisch, and Thomas (1980) falls near the regression
line of Jarrett (1976) with laboratory data falling a considerable distance below
the line.
23
Chapter 4 Experiments and Results

 Previous Page
