

applied steady-state ebb flows with a parallel jetty system. A comparison of
Runs 4 and 9 (26-min tide period) in a similar manner shows that the larger sedi-
ment size develops a larger equilibrium area. This difference was possibly related
to the difference in initial conditions, because with Run 4, a wider, shallower
channel existed at the start. Also the different hydraulic characteristics that exist
for the two tidal periods may be a factor.
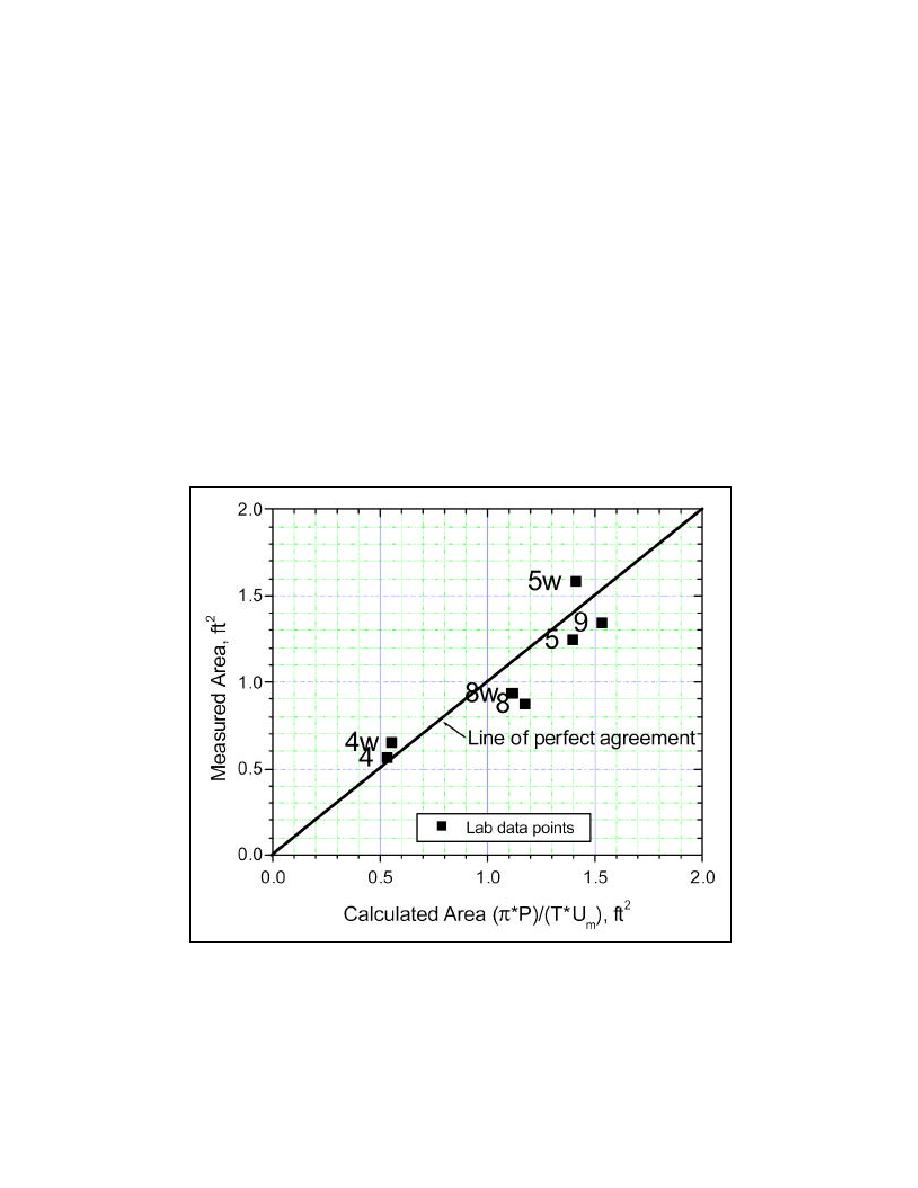
Substituting the current and area data from Table 2 in Equation 2 produces a
calculated versus measured minimum-inlet-area plot shown in Figure 12. The run
numbers are printed next to the data points, with a "w" next to a run number indi-
cating the equilibrium area after tide plus waves. Despite the differences dis-
cussed in the previous paragraph, all the data points fall in reasonable proximity to
the line of agreement. The average percentage difference between the measured
and predicted areas is 14 percent. The standard error from the predicted value
was 0.016 sq m (0.17 sq ft). The percentage difference for the finer sediment was
12 percent and for the coarser sediment was 18 percent. The correlation coeffi-
cient r2 was 0.82.
Figure 12. Comparison of measured and calculated equilibrium areas (to convert
areas to square meters, multiply by 0.0929)
21
Chapter 4 Experiments and Results

 Previous Page
