

January 13, 2004
14:38
WSPC/101-CEJ
00092
Recent Developments in the Geomorphic Investigation
593
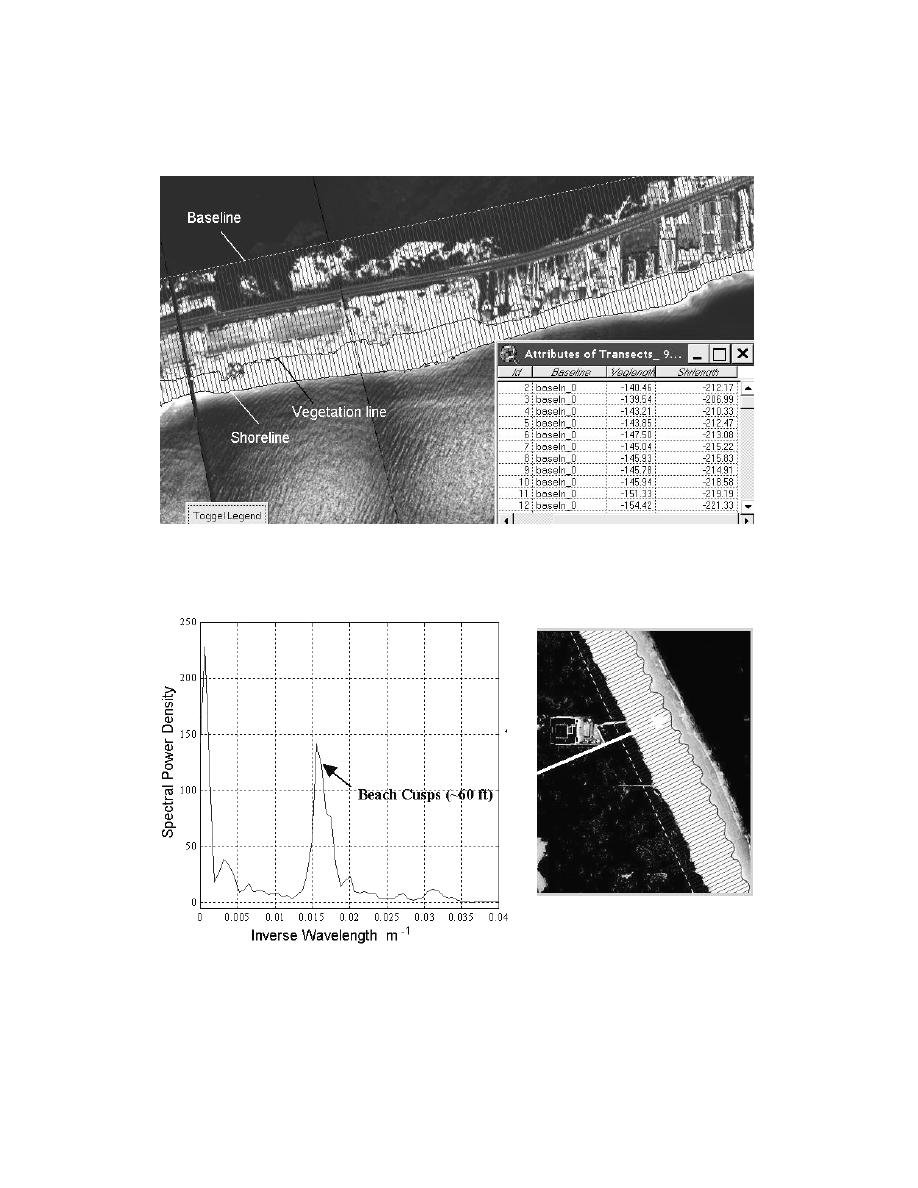
Fig. 21. Example of high resolution shoreline mapping in GIS. Vegetation and wet/dry lines were
mapped using image analysis. Table insert shows the automated extraction of shoreline position
with respect to a baseline.
Fig. 22. Example of high resolution shoreline mapping used to compute power spectrum of cuspate
beach morphology.

 Previous Page
