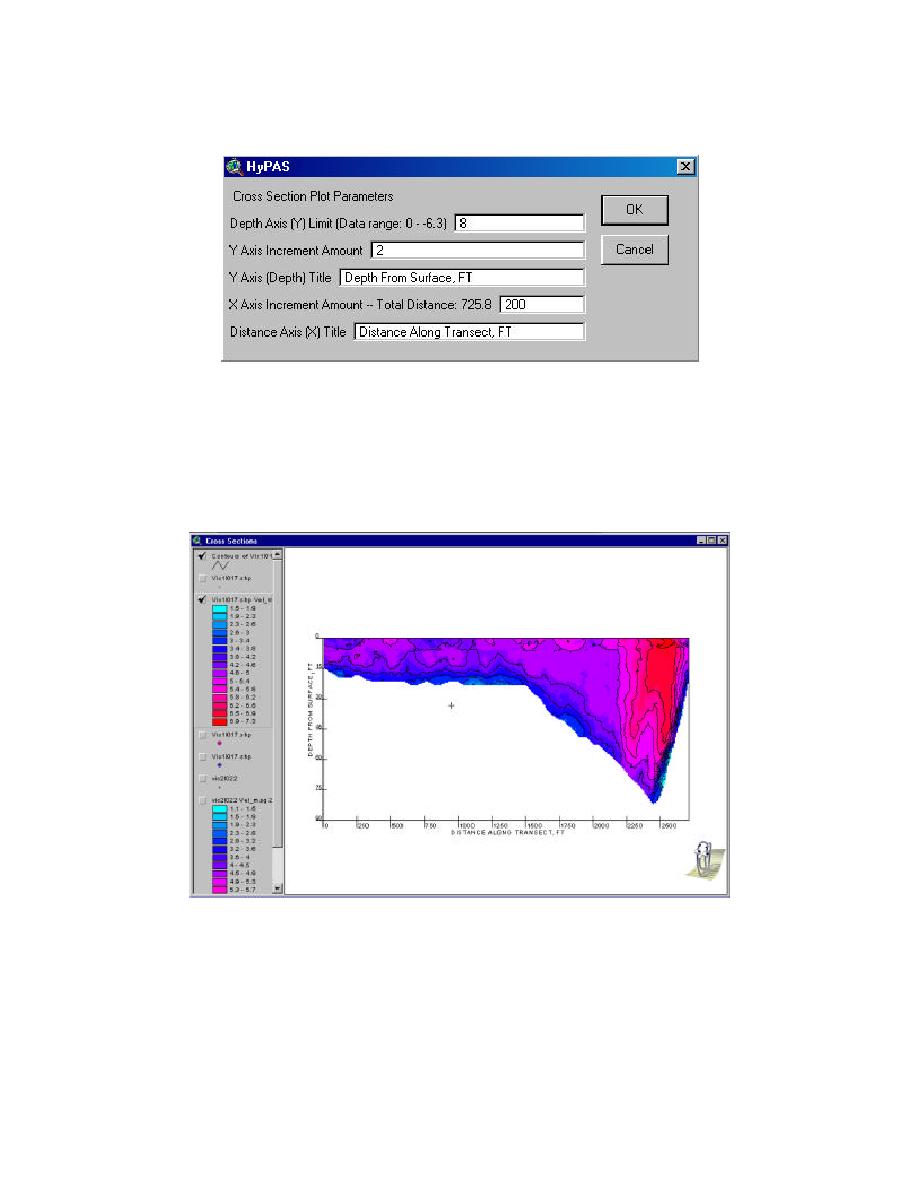
depth axis limit.
Figure 3-10. Menu for cross-section plot parameters
After the grid data set is completed, HyPAS prompts for the contour interval and
base contour (Figure 2-11). Enter the desired contour interval and base contour.
HyPAS creates three themes in the Cross Section view: a point theme containing
the cross-section points with each bin, a contour lines theme, and a theme with the
interpolated data (Figure 3-11).
.
Figure 3-11. Example of the results from generating cross sections
3-5
Chapter 3 Cross-Section Analysis


 Previous Page
