Annual Net Longshore Transport
Simulations were first carried out to reproduce annual net sand transport rates observed
along the FIMP coast. The simulation period 1983 - 1995 was selected since hindcast
waves and measured shorelines were available. The simulation involved an approximate
calibration of the model where the value of the transport coefficient K was determined
based on the agreement with available information on the annual net transport rate. This
information derives mainly from sediment budget studies for the south shore of Long
Island (Kana 1995; Rosati et al. 1999). Based on trial simulations, the value on transport
coefficient was selected to K=0.12, which is about a third of the recommended value for the
CERC formula (K=0.39, for significant wave height). This value on K produced calculated
rates that agreed well with trends and values reported in the most recent literature (Rosati et
al. 1999). The estimated ebb shoal equilibrium volume for Shinnecock Inlet was about
8 million m3 and for Moriches Inlet 6 million m3. Corresponding initial volumes in 1983
were determined to be approximately 3.5 and 4.9 million m3 (Morang 1999), respectively.
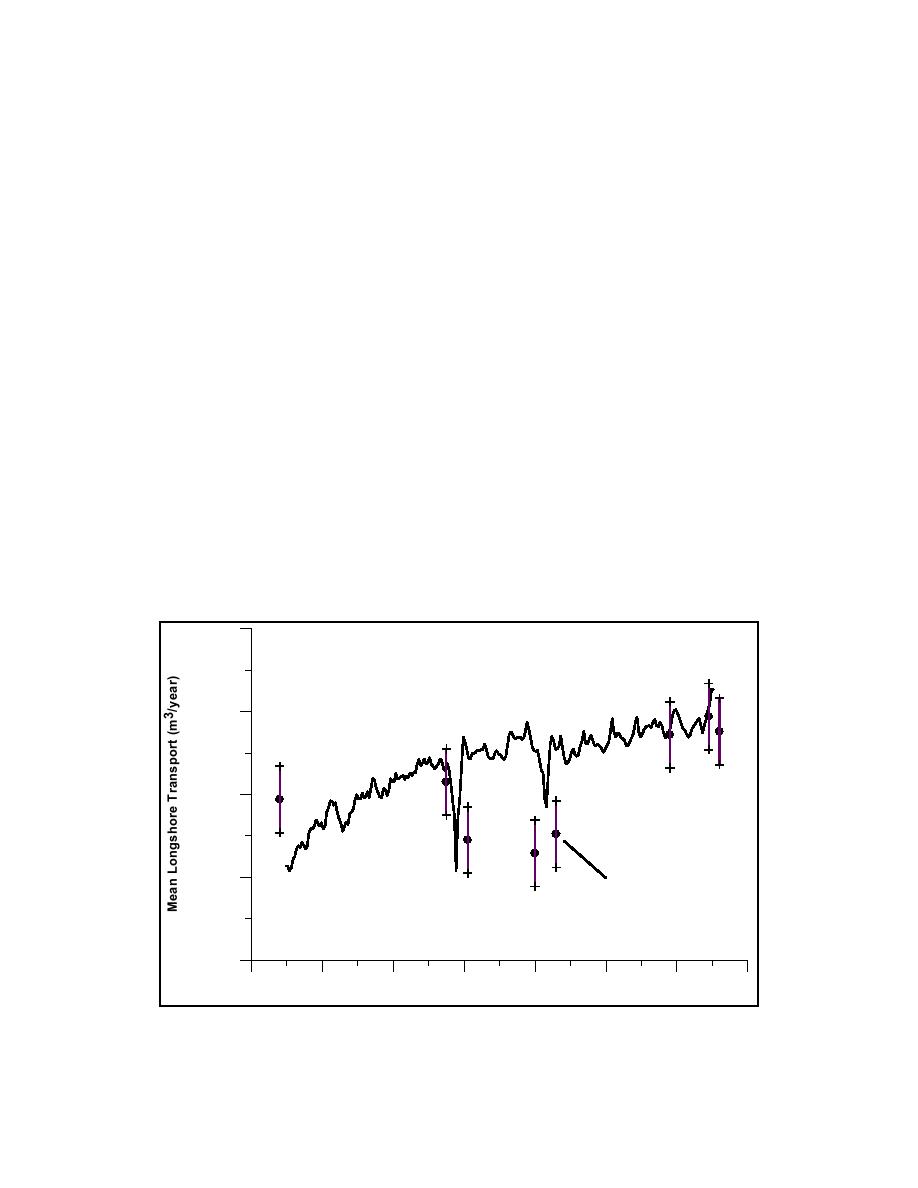
Fig. 4 plots the calculated annual net longshore transport rates compared with the rates
estimated in the sediment budget study by Rosati et al. (1999). The calculated transport
rates display expected behavior of increasing rates going west, with a near-zero rate near
Montauk Point. Estimates of transport rates from the sediment budget included in Fig. 4
encompass the most likely value as well as an interval over which the rate could vary. The
figure shows marked disturbances of the inlets on the transport pattern. Because both
Shinnecock Inlet and Moriches Inlet act as sediment sinks, the calculated transport rates
drop substantially around the inlets. The derived rates confirm this behavior, although they
are somewhat less than the calculated ones at Moriches Inlet.
300000
Fire Island
Atlantic Ocean
Inlet
Moriches
Shinnecock
Inlet
Inlet
200000
100000
Data from
0
Rosati et al. (1999)
Land
-100000
0
20
40
60
80
100
120
140
Distance West from Montauk Point (km)
Fig. 4. Calculated annual net transport rates along the FIMP area based on wave data from
1983-95 compared with transport rates derived from sediment budget studies.
Larson, Kraus, and Hanson
10


 Previous Page
