Figure 7. Moriches Inlet breach development (photograph April 1976).
The barrier island was divided into three horizontal sections. The narrowest
initial barrier island cross-section was specified according to an interview with
Mr. Gilbert Nersesian, former senior coastal engineer at the U.S. Army Engineer
District, New York. Width elsewhere was estimated according to an April 1976
aerial photograph (most recent photograph available before the breach). Water
level was specified from the National Ocean Service Battery gauge at the
southern tip of Manhattan, NY. The longshore sediment transport rate
calculated from the CERC formula was driven by WIS data, calibrated by
parameters that produced the best results were α = 0.05 and β = 50.
The model was run for 280-day simulation time starting 13 January 1980.
Several days later, a breach was calculated to occur on the lowest barrier
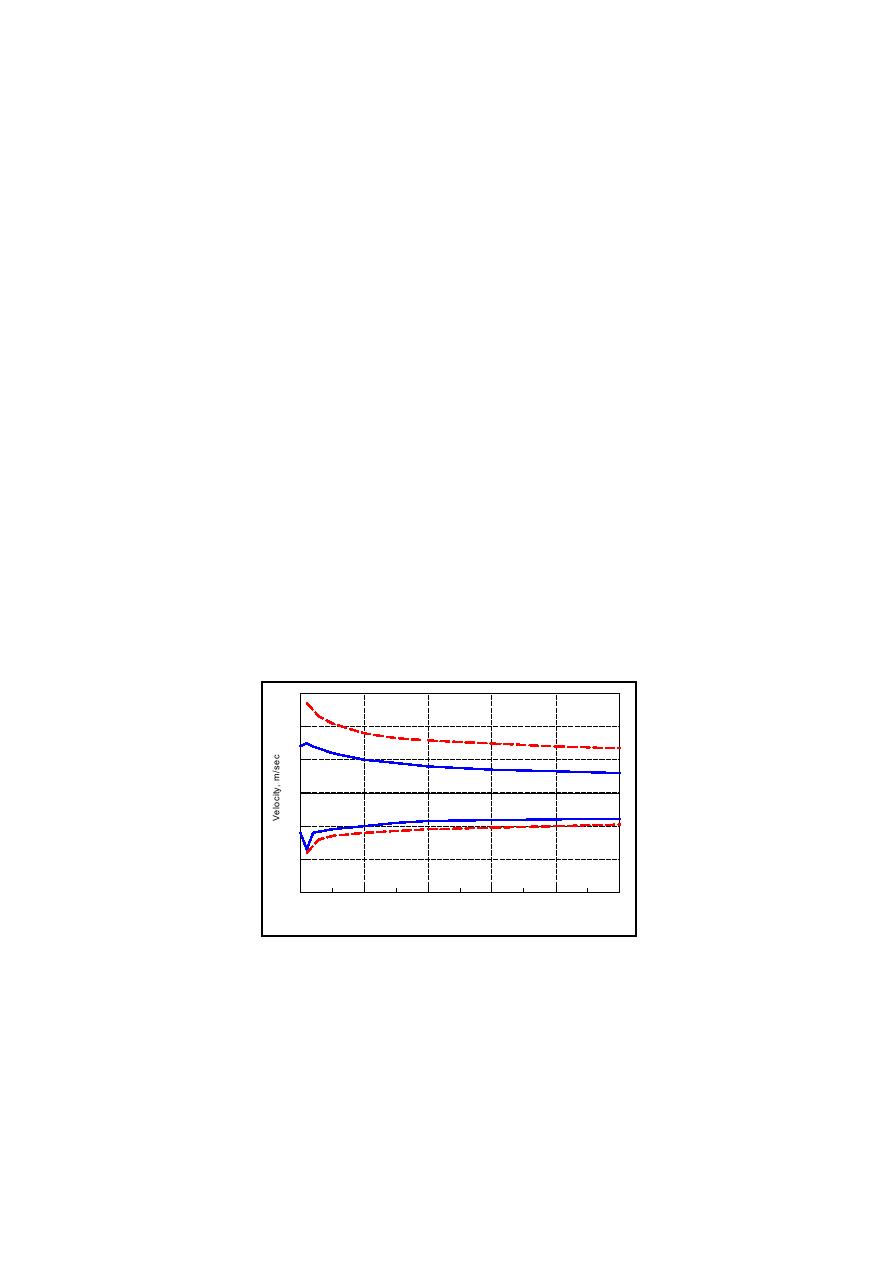
section. Fig. 8 plots a filtered envelope of the calculated current velocity in the
inlet and breach. The velocity exceeded 2.5 m/sec when the simulated breach
opened. After the storm subsided, tidal exchange between ocean and bay
continued to enlarge the breach section. Over time, velocities in both the inlet
and breach became smaller, with the breach section becoming another inlet.
Flow in the breach was calculated to be flood biased, whereas flow in the inlet
was ebb biased, produced by the non-linear friction term in Eq. 1. The
calculated current is compatible with that reported by Schmeltz et al. (1980),
who document a velocity of 1.5 - 2.1 m/sec in the breach section.
3
2
Breach Flood
1
Inlet Flood
0
Inlet Ebb
-1
Breach Ebb
-2
-3
0
50
100
150
200
250
6/11
1/13
3/3
4/22
7/31
9/19
Days from 13 Jan 1980
Figure 8. Filtered envelopes of current velocity in breach and inlet.
Calculated breach width and depth are plotted in Fig. 9 and Fig. 10,
together with the measurements. The simulated breach reached the east jetty in
10


 Previous Page
