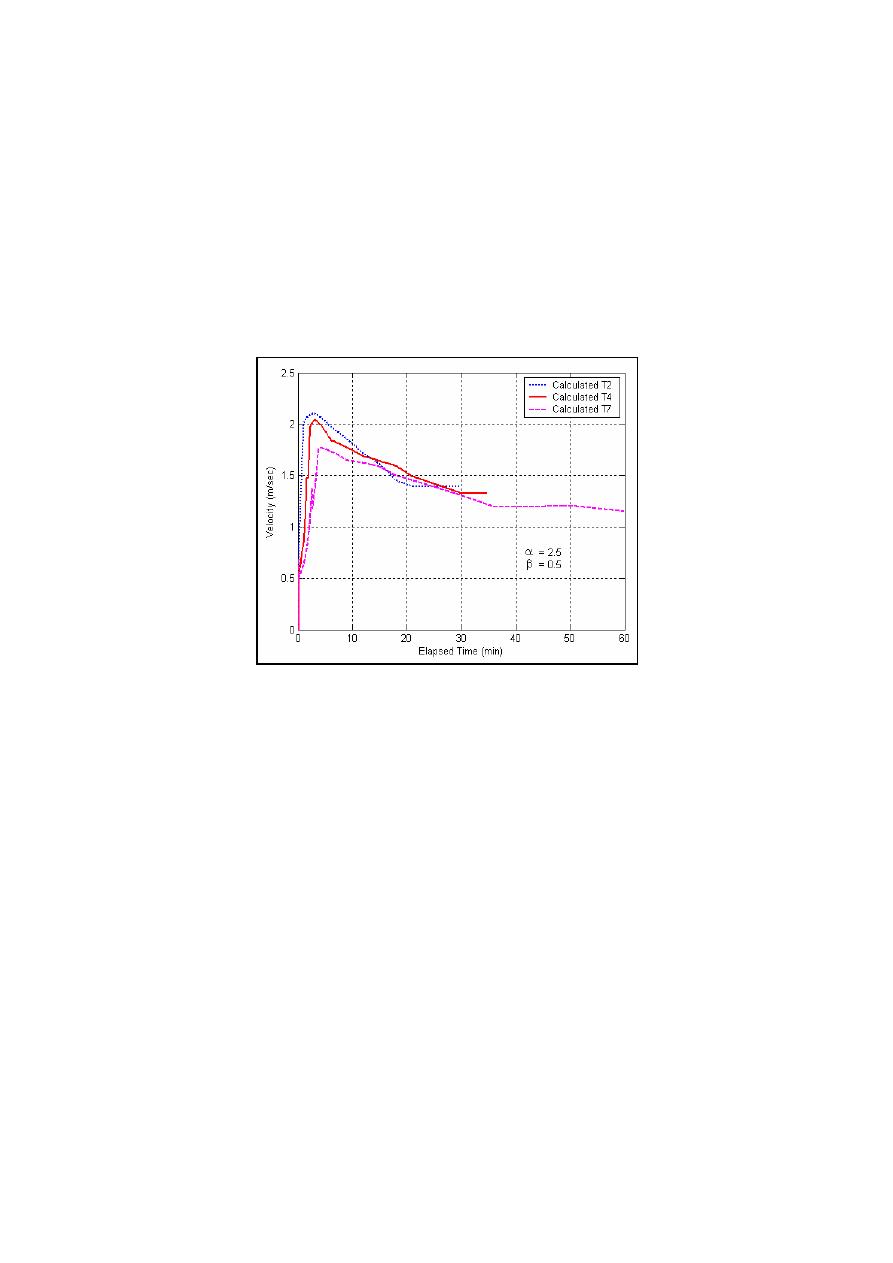
De Looff et al. (1996) identified a critical water velocity of 1.0 m/sec at which
growth in breach width halted, similar to that found for stable inlets in the field
(Bruun 1966). The numerical model reproduced this behavior (Fig. 5), with the
calculated velocity rising rapidly as the breach first opened, then gradually
decreasing to approach 1.0 m/sec as the breach widened and deepened.
Figure 5. Calculated velocity in breach experiment of DeLoof et al. (1996).
3.2. Moriches Inlet Breach, 1980
With reasonable results obtained from comparison of model predictions and
laboratory data, a study was performed to simulate field observations. The
model was enhanced to include wave setup, longshore sediment transport
calculated with the CERC equation, and breach channel infilling by deposition.
Kraus and Hayashi (in preparation) describe these enhancements.
On 14-16 January 1980, a storm opened a breach at the narrowest point in
the barrier island about 310 m east of the east jetty in Moriches Inlet, NY
(Schmeltz et al. 1982; Sorenson and Schmeltz 1982). Wave data taken from the
nearby Wave Information Study hindcast Station 111 are plotted in Fig. 6. The
storm of mid January 1980 that opened the breach was followed by several
winter storms, including a large storm in mid March. Kraus (2003) summarizes
previously reported information about this breach. To obtain additional data on
breach response, seven aerial photographs taken after the breach opened were
analyzed in a GIS to obtain the breach width (Fig. 7).
8


 Previous Page
