3.
Results
This section compares model calculations with physical model data of dike
breaching to demonstrate general properties of the model, and with field data for
a dual opening situation of a breach that formed next to an inlet jetty.
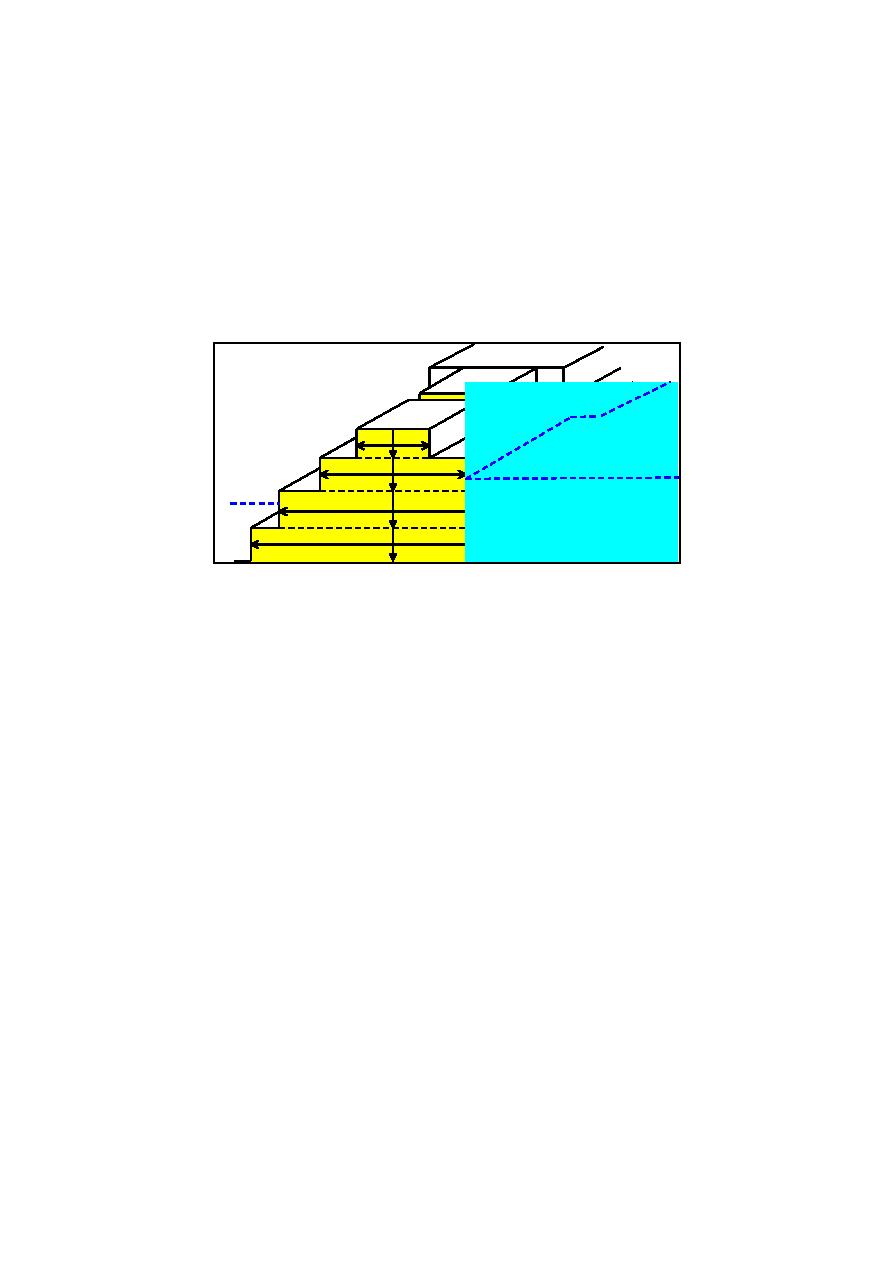
Pilot Channel
z0
x0
L1
z1
L2
MSL
z2
Bay Level
L3
z3
L4
z4
Figure 2. Layered barrier island cross section and horizontal section.
3.1. Comparisons to Physical Model
De Looff et al. (1996) report results of a physical model of a sand dike installed
in a basin to investigate growth in breach width for various dike configurations.
The breach was initiated by opening a small pilot channel at the top of the dike.
Breach width, upstream water level, and surface water velocity by were
recorded for eight cases with different cross-sections. In the present study, three
cases (T2, T4, and T7) were examined to investigate the dependence of the
numerical model on initial sand volume. Fig. 3 shows the initial cross-sections
for T2, T4, and T7. Several layers were defined to represent the dike. With T4
as the standard dike, Case T2 had smaller sand volume, whereas T7 had larger
volume.
Calibration of the present breaching model was performed by adjusting the
sediment transport parameters for Case T4, which yielded α = 2.5 and β =0.5
for a best fit to the measurements. With these parameters fixed, simulations
were run for Cases T2 and T7. The calculations, Fig. 4, follow the trend of the
observations, with the width growing faster for dikes with less volume.
Measurements of depth were not available to quantitatively judge performance
of the numerical model; lack of information on measured depth and downstream
water level make quantitative comparison infeasible.
6


 Previous Page
