

through the localized low areas. Once the dune crest is
Wamsley 2003).
The Hatteras breach destroyed utility
submerged, erosion occurs rapidly and can be catastrophic.
infrastructure and severed North Carolina Highway 12, isolating
Hatteras Village from the rest of Hatteras Island. Parking lots
After the complete wash out of the dune, a breach widens by
and buildings near the breach were also destroyed. Highway 12
erosion and collapse of the bank and deepens as flow scours the
is the only transportation route east from the village. Residents
channel. Margin shoals are often formed immediately after
were unable to drive to work and home. Businesses at Hatteras
breach opening. If the breach scour is sufficiently deep, water
Village and on Ocracoke Island experienced loss of tourism
flow can occur between the two water bodies on each side of the
revenue because of the restricted access.
barrier, even after the storm subsides. Tidal flow then continues
to widen and deepen the breach channel. If the breach flow is
Despite the potential societal and environmental costs
strong enough to flush littoral drift-derived sediments from the
associated with breaches, relatively little information is known
breach faster than it is introduced, the breach is maintained and a
on the physical processes of breaches. The Hatteras breach was
tidal inlet formed. The flushing of sediment by the tidal current
in close proximity to the USACE Research and Development
may create an ebb and/or flood shoal.
Center, Field Research Facility (FRF), which provided an
opportunity to study large breaches of barrier islands. High-
Hatteras Island was breached by elevated water levels and
resolution surveys of the breach produced needed data on the
wave attack from the ocean side. The barrier is approximately
hydrodynamic and morphologic evolution of barrier breaches.
500 ft wide where the breach occurred, one of the narrowest
The surveys not only qualitatively describe the course of breach
sections along Hatteras Island. The long-term shoreline
evolution, but also provide quantitative data for numerical
recession rate at this location is about 3 to 4 ft/year (Overton and
models of coastal breaching under development by the USACE.
Fisher 2004). Airborne LIDAR surveys by the U.S. Geological
Survey (USGS) and National Aeronautics and Space
Two topographic and shallow water surveys were conducted to
Administration (NASA) show that the breach occurred not only
capture the short-term temporal changes in breach morphology.
at a location of minimum island width, but also at a minimum of
The first survey was conducted over 3-5 October 2003. A single
island elevation (Sallenger 2004). The primary cause of the low
multi-beam survey was conducted on 5 October. The second
dune elevations is likely wave attack as a result of the receding
survey was conducted from 13-16 October. The bathymetry
shoreline. However, beach access may also have contributed.
surveys of the breach channels, margin shoals, and flood shoal
The breach occurred near a parking lot for beach goers. Dunes at
were performed with a Real-Time Kinematic (RTK) GPS
access points are often lower due to foot traffic. If possible,
Waverunner survey system. The system is designed for shallow
coastal mangers should discourage beach access at narrow
water applications and can reach areas not accessible with more
regions of barrier islands and establish access points where the
conventional survey methods. Topography was surveyed with an
barrier island is wide.
RTK-GPS system to clearly identify the shoreline of the beach
and breach edge. The "breach islands" in the middle of the
The narrowing and lowering of Hatteras Island at this location
breach were also topographically surveyed to capture their slopes
weakened the barrier and subjected it to breaching. Evidence of
and shorelines. The multi-beam survey was performed to
powerful overtopping water flow was observed at the breach.
measure the size and extent of the ebb shoal. The multi-beam
Brush and other vegetation adjacent to the breach channels were
system also surveyed the main breach channel. Freeman,
matted and flattened toward the Pamlico Sound by overwashing
Bernstein, and Mitasova (2004) give a complete discussion of the
flow. Channelization at the lowest points in the barrier scoured
survey plan and techniques.
the breach channels.
During the first survey period, drogues were timed to
BREACH MORPHOLOGY AND SHORT-TERM
approximate surface currents through the main breach channel.
EVOLUTION
Drogue measurements were made at various times throughout
the tidal cycle over 4-6 October 2003. The current was also
The morphology and short-term evolution of the breach were
measured with an Acoustic Doppler Current Profiler (ADCP) in
examined through spatial surface analysis of three-dimensional
the breach during two field deployments. The first current
digital elevation models (DEMs) created with high-resolution
survey took place over 16-17 October near the time the second
topographic and bathymetric data. Depths over the ebb shoal
morphology survey was being conducted. The current was
were collected on 5 October, in addition to the surveys of 3-5
surveyed again on 24 October. Water levels were also recorded
October (Survey 1) and 13-16 October (Survey 2). Survey 2 had
near the breach on both the Atlantic Ocean side and the Pamlico
Sound side from 3 October to 12 November 2003. The purpose
of this paper is to document the short-term morphologic
evolution and hydrodynamic characteristics of the breach based
on an analysis of the collected data.
OVERVIEW OF BREACHING PROCESS
Breaching potential is maximized if the barrier is low and
narrow. Narrowing of the barrier results from shore erosion on
either the ocean or bay/sound side. Lowering of the barrier
results from dune degradation. Several causes of dune
degradation can be identified, including fixed footpaths for beach
access, seepage, undercutting and failure from wave attack, and
wave overtopping. The narrowing and lowering of the barrier
creates localized low profiles in the dune system. When water
levels are elevated, inundation occurs and water begins to flow
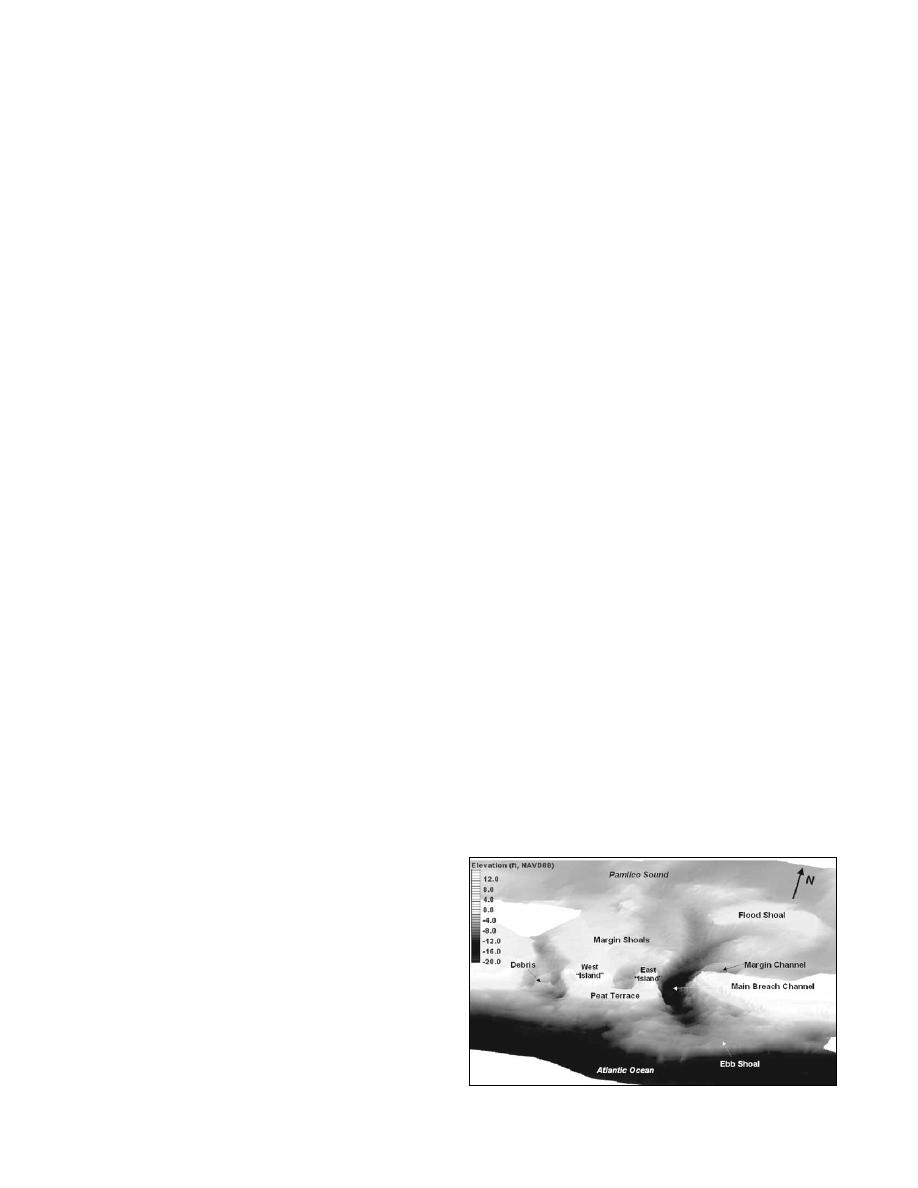
Figure 3. Digital elevation model of Hatteras Breach.
10
Shore & Beach Vol. 72, No. 2, Spring 2004, pp. 9 - 14

 Previous Page
