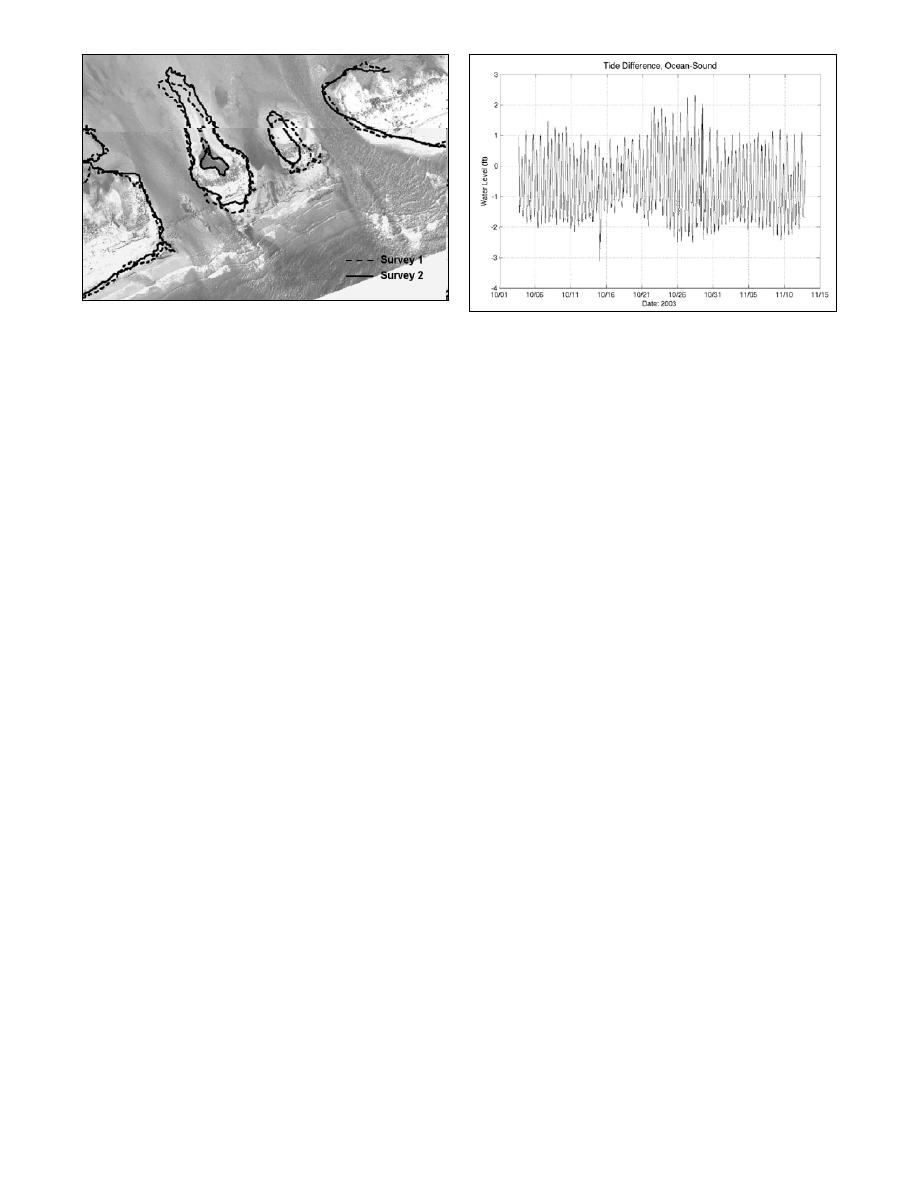
Figure 7. Comparison of the 0-contour (NAVD88). The aerial
Figure 8. Pamlico Sound and ocean water level difference, 3
photograph was taken on 24 September, tide elevation -1.3 ft
October to 12 November 2003.
NAVD88 (NCDOT photograph).
northerly direction and also elongated by approximately 65 ft.
middle channel shoaled approximately 2.5 ft in the 10 days
The 0-contour on the front side of each island receded. This
between surveys. The sediment likely originated at the margin
recession, however, was not from erosion of the peat terrace.
shoals on the sound side and could not be flushed out by flow
The peat terrace elevation was below 0 NAVD88, and the sandy
restricted by the peat terrace. The central and seaward portions
material on top eroded during higher tide elevations.
of the middle channel did not change between Surveys 1 and 2.
Figure 7 also shows beach shoreline change within about 500
The main breach channel experienced the greatest amount of
ft of the breach. On the west side, the beach eroded
change. Defining breach width as the distance across the channel
approximately 35 ft. Sediment supplied by longshore transport
between the NAVD88 0-contour (which corresponds to +0.44 ft
advanced the shoreline to the east by as much as 55 ft within
msl), the breach widened by approximately 125 ft on the ocean
about 425 ft of the breach channel. The beach tended toward
side, 65 ft through the middle part of the channel, and 25 ft on the
erosion at greater distances from the breach.
sound side. From the center of the barrier toward the sound, the
main channel migrated approximately 20 ft to the west over the
WATER LEVEL MEASUREMENTS
10-day period while on the ocean side the channel migrated over
Water level differences between the sound and ocean drove the
80 ft to the west. The average channel depths were maintained
currents that maintained the breach. Two Seabird SBE-26
and maximum channel depths generally increased through the
gauges were installed to measure water levels in the sound and
middle part of the channel and decreased on the sound side over
ocean from 3 October to 12 November 2003. The sound gauge
the 10-day period. The average cross-sectional area of the
was deployed approximately 1,650 ft north-northeast of the
breach channel increased from 3,400 to 4,000 sq ft.
breach in a water depth of 4 ft NAVD88. The sensor on the gage
Figure 7 is a comparison of the 0-contour (NAVD88) between
was at approximately 2.3 ft NAVD88. The ocean gauge was
Surveys 1 and 2. The recession of both channel banks at the ocean
attached to a piling near the seaward end of the damaged Cape
end of the breach is evident. The east bank receded 25 to 45 ft
Hatteras Fishing Pier in Frisco, NC. The pier gage was 1.4 miles
while the west bank moved 40 to 80 ft. On the sound end of the
east-northeast of the breach where the nominal depth was 10 ft
breach channel, the east bank advanced approximately 25 ft,
NAVD88, and the sensor was located at a depth of 5.6 ft
pushing the channel to the west. This end of the channel also
NAVD88. The tide gauges sampled pressure at 4 Hz and
continued to widen, however, as the west bank receded about 45 ft.
recorded a mean value at 10-min intervals. Temperature and
conductivity were also measured, from which salinity and
The prograding shoulder of the barrier island was supplied
density were computed. Water level was adjusted for variations
sediment from the ocean end of the breach bank and the sound
in density. For shallow water, the corrections were small (~ 0.03
side of the barrier island. A strong current was observed in the
ft) compared to elevation differences (~ +/- 1.6 ft).
margin channel on the east side of the breach. Bank erosion was
easily observed at this location. As the tide fell, a scarp formed
The measured water level (head) difference between the ocean
on the sound side of the barrier. During lower tide elevations, the
and sound are plotted in Figure 8. Water level head differences
strong flow removed sand from the base of the scarp until a
exceeding 2.3 ft were observed on both flood and ebb currents.
tension crack formed, leading to mass failure. The sandy bank
Water levels for the pier, sound, and the head difference from 14-
material slumped into the margin channel, moving down the
18 October are plotted in Figure 9 along with wind
bank slope where the tidal current carried it downstream. At
measurements from the Hatteras Weather Service (Mitchell
higher tide elevations, the scarp became submerged and was
Field, 2.5 miles east of the breach). Wind contributes to head
smoothed by the current flow and wave action. Recession of the
difference, particularly in determining sound water levels.
0-contour as a result of this process is seen in Figure 7. The
Pamlico Sound, having a large surface area and shallow water,
maximum shoreline recession measured over the 10-day period
can experience large wind-driven setup. On 15 October, the
at the margin channel was approximately 20 ft.
wind switched from having a west component to an easterly
component, resulting in setup in the sound and a large negative
Figure 7 illustrates the elongation of the margin shoals behind
head (ocean levels lower than the sound) of -3.1 ft. There was a
both breach islands.
The east island shoal advanced
gap in the wind data on 15 and 16 October, but based on
approximately 65 ft. The west island shoal migrated in a
measurements at the FRF (66 miles north of the breach), the
Shore & Beach Vol. 72, No. 2, Spring 2004, pp. 9 - 14
12


 Previous Page
