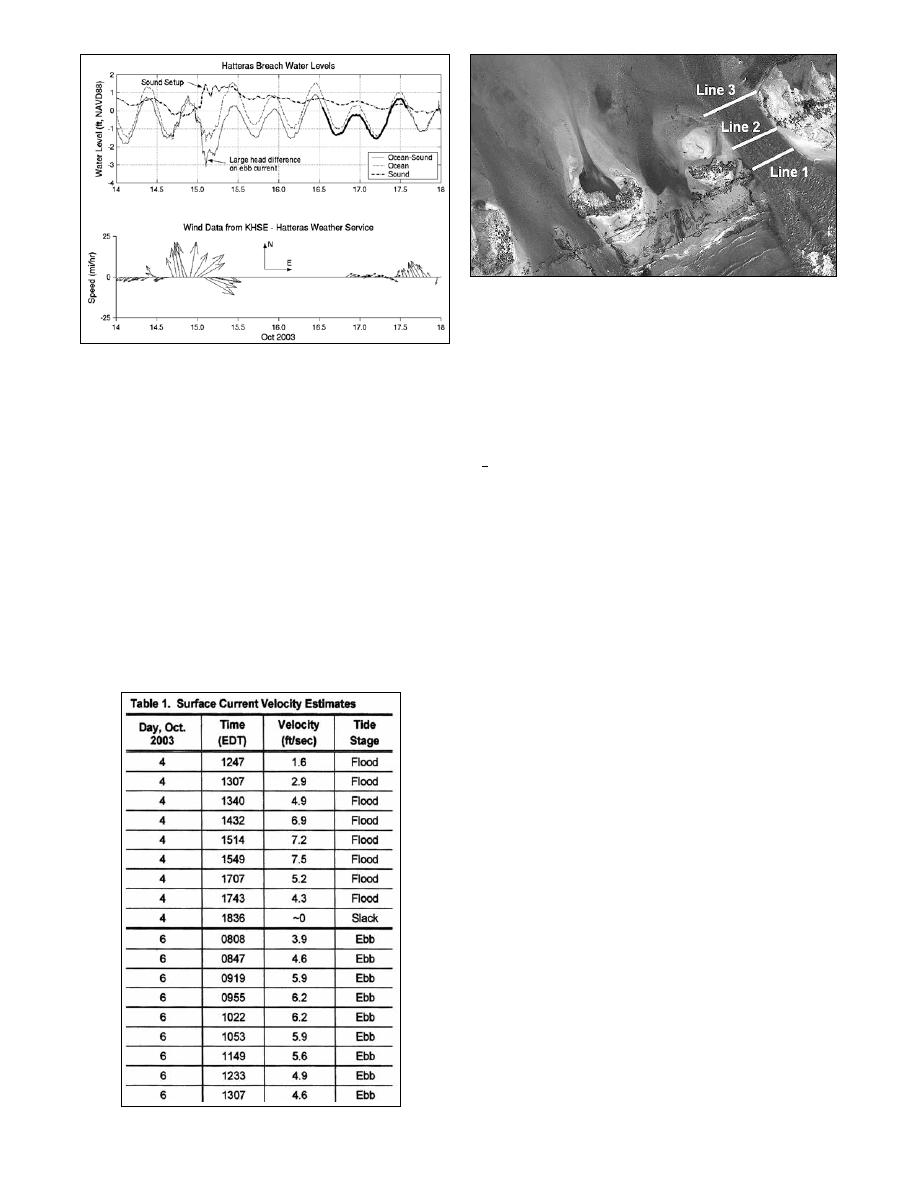
Figure 10. Approximate location of ADCP transects (NCDOT
photograph).
was placed approximately midway along the channel where the
surface currents appeared to be the strongest and where the
Figure 9. Ocean and sound water levels, head difference, and
channel was deepest according to previous bathymetric surveys.
wind vectors. Bold line indicated times when bottom mounted
The ADCP was an RD Instruments (RDI) WorkHorse Monitor
ADCP was operational.
(1,200 kHz) and was fixed at a nominal depth of approximately
17 ft. The ADCP operated for 25 hr from 16 October 1300 EST
wind continued to be directed toward the east and south,
to 17 October 1400 EST, 2003. Cross channel ADCP transects
favorable for setup in the southeast corner of the Pamlico Sound
were also made from an instrumented Zodiac inflatable boat on
near the breach. As a result, a nearly continuous ebb current
16-17, and 24 October. The ADCP employed for the transect
flowed for approximately 32 hours.
measurements was also a 1,200 kHz WorkHorse Monitor. ADCP
CURRENT MEASUREMENTS
data were collected with RDI WinRiver software set to sample at
5 Hz but was only able to maintain approximately 2.5 Hz. The
The current through the main breach channel was estimated by
program was configured for 1.31 ft range bins and also acquired
timing surface drifters during Survey 1 and measured with an
serial data outputs from an echosounder and RTK GPS unit. The
ADCP during two field deployments, the first of which coincided
echosounder (Knudsen 320B Echosounder) operated at 200 kHz
with Survey 2. Drogues were timed during the flood tide on 4
and a nominal sound speed of 4,921 ft/sec, with sampling rate of
October and during ebb tide on 6 October. Surface current
5 Hz. The roving GPS was a Trimble 4700 equipped with a
velocity was estimated from these measurements, as listed in
Compact L1/L2 antenna. The base station was a Trimble
Table 1.
4000SSE. Surveys were Real-Time Kinematic (RTK) with
approximately 0.07 ft accuracy in both the horizontal and
The ADCP measurements were on 16, 17, and 24 October
vertical, while sampling GGA NEMA string output at 1 Hz. GPS
2003. During the first deployment, a bottom-mounted ADCP
coordinates were interpolated in post-processing to match the
ADCP sampling rate. Echosounder data were sub-sampled by
the WinRiver collection program because it only retains the most
recent depth sample after the ADCP sample. The small
mismatch in sampling times was not significant for this study.
Transect lines were chosen along three locations
approximately at the ocean end of the breach, near the middle,
and on the sound side (Figure 10). The Zodiac crabbed (at an
angle to the current) across the breach at a best attempt of
constant speed, with each transect taking 2 to 3 min. Typically,
two or three transects were made at each location before
proceeding to the next line. Approximately 140 total transects
were completed during both deployments. In addition, 12
current measurements were made using the boat as a drogue and
currents computed from the recorded GPS time and position.
The current velocity was calculated by averaging
measurements from the repeated transects at each location. A
best-fit line was computed (least square linear sense) for each
group of transects. Current velocity measurements were then
averaged at 16.4 ft intervals along the computed transect line
using measurements within 16.4 ft (horizontally) of the interval
coordinate. Current velocities were not averaged vertically,
maintaining the 1.31 ft vertical spacing.
An example of an averaged ADCP ebb current transect is
shown in Figure 11 for Line 1 on 16 October. Strongest currents
Shore & Beach Vol. 72, No. 2, Spring 2004, pp. 9 - 14
13


 Previous Page
