

controlled in two horizontal directions allowing automatic recording of velocity
at precise, predetermined locations throughout the testing area. Usually, velocity
data are collected on a uniformly spaced grid with the probe collecting a time
series of instantaneous velocities at each grid point before moving to the next
location. The velocity time series in the two orthogonal horizontal directions at
each point are averaged to provide two components of the velocity vector.
Sampling rate and duration are adjustable, but typically data are collected at a
100-Hz rate for 10 sec at each point. Because the flow is quasi-steady, the final
result is a map of velocity vectors detailing the flow throughout the measurement
region.
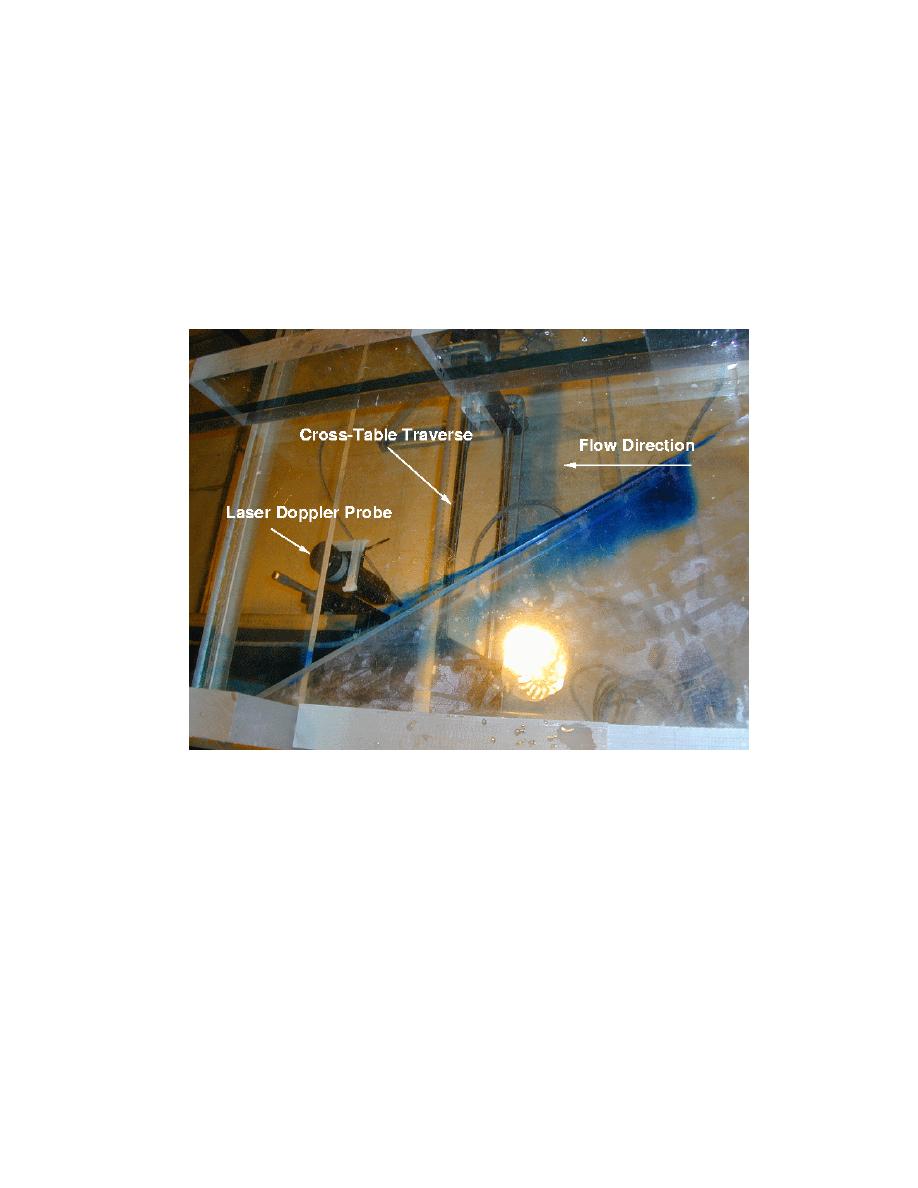
Figure 5. View of traversing system looking down through glass bottom
Velocity measurements using the traversing LDV system require a
transparent horizontal bottom so that the four individual laser beams will have
equal refraction and converge at a point. Consequently, velocity measurements
cannot be made when actual bathymetry is carved into Plexiglas and placed over
the horizontal glass bottom because the laser beams would not converge to a
point. However, a compromise is possible if the bathymetry is idealized as a
series of stepped horizontal surfaces fabricated of Plexiglas. Flow quantification
for models incorporating complex bathymetry must be done using surface-
piercing instruments such as LDV probes, microimpellers, or by using time-lapse
photography of surface tracers.
8
Chapter 2 Coastal and Hydraulics Laboratory Flow Table

 Previous Page
