

intended to give a broad overall representation of the flow patterns, whereas the
small-area model would permit a closer look at the flow features in the general
vicinity of the Port of Anchorage.
Large-Area Model Description
The seaward boundary of the large-area idealized model reproduced about
10.3 nautical miles (n.m.) on a transect through Fire Island as shown in Figure 6.
The shoreward boundary extended a distance of about 5 n.m. upstream of the
Port of Anchorage. This area was scaled to fit within the 1.22-m (4-ft) width and
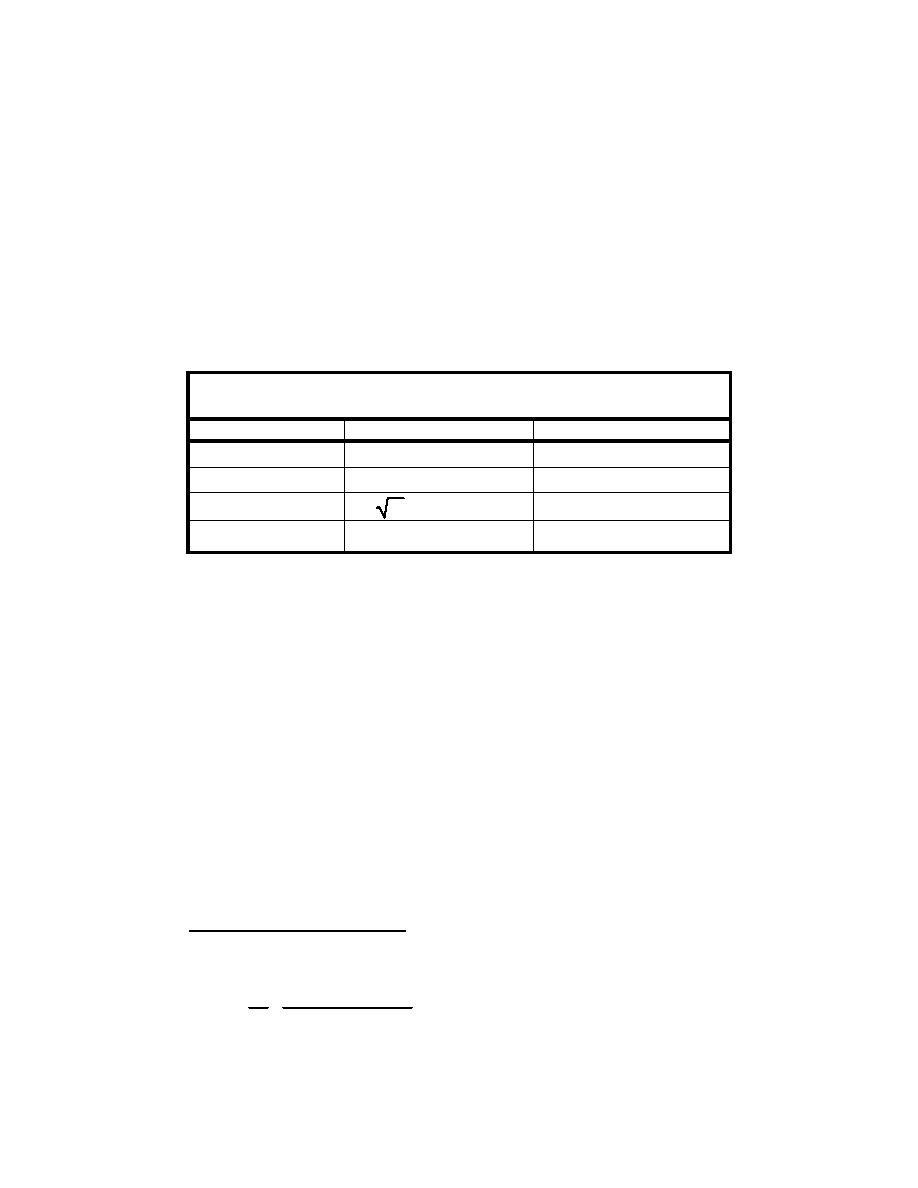
area model are listed in Table 2 along with approximate model equivalences.
Table 2
Scale Ratios for Large-Area Model
Scale
Scale Value
Model Equivalence
NX = 15,625
1,300 ft ≈ 1 in.
Horizontal Scale
NZ = 480
Vertical Scale
40 ft = 1 in.
NV =
NZ = 21.9
Velocity Scale
2.2 m/sec = 10 cm/sec
NQ = NXNZ3/2 = 164,316,767
Discharge Scale
203,000 cu m/sec = 1.24 liters/sec
Depths in the model were idealized by a horizontal surface located at an
elevation corresponding to depths of el 0 and by the glass bottom of the flow
vertical. Figure 7 shows the modeled region as it was situated on the flow table.
The red lines represent the shoreline, and the blue lines are el 0.
The ERDC Model Shop converted the shoreline and el 0 contours into
appropriate commands for cutting by a computerized router. The components for
the idealized model were then cut from blocks of 3.81-cm (1.5-in.-) thick
Plexiglas (Figure 8). Figure 9 shows the large-area model during assembly.
The scaled idealized model was operated by placing it on the flow table,
turning on the recirculation pump, and adjusting the valves to give the
appropriate total discharge. The adjustable downstream weir was used to set the
constant water level. Thus, the model simulated steady tidal flow of given total
discharge at the selected tide elevation. Simulation of a variable-flow tide
hydrograph was not supported at this time. Changing between ebb and flood tide
was accomplished by rotating the entire model by 180 deg on the flow table so
the water flowed across the model in the opposite direction.
1
Scale ratios are defined as the value of a parameter in the prototype divided by the value in the
model. For example, the scale ratio of the characteristic horizontal length X is:
Xp Value of X in Prototype
NX =
=
Value of X in Model
Xm
2
All elevations (el) cited herein are in feet referred to mean lower low water (mllw) datum (to
convert feet to meters, multiply number of feet by 0.3048).
11
Chapter 3 Idealized Cook Inlet Models

 Previous Page
