and the dominant turbulence terms would be those shown to be in similitude in
the previous section.
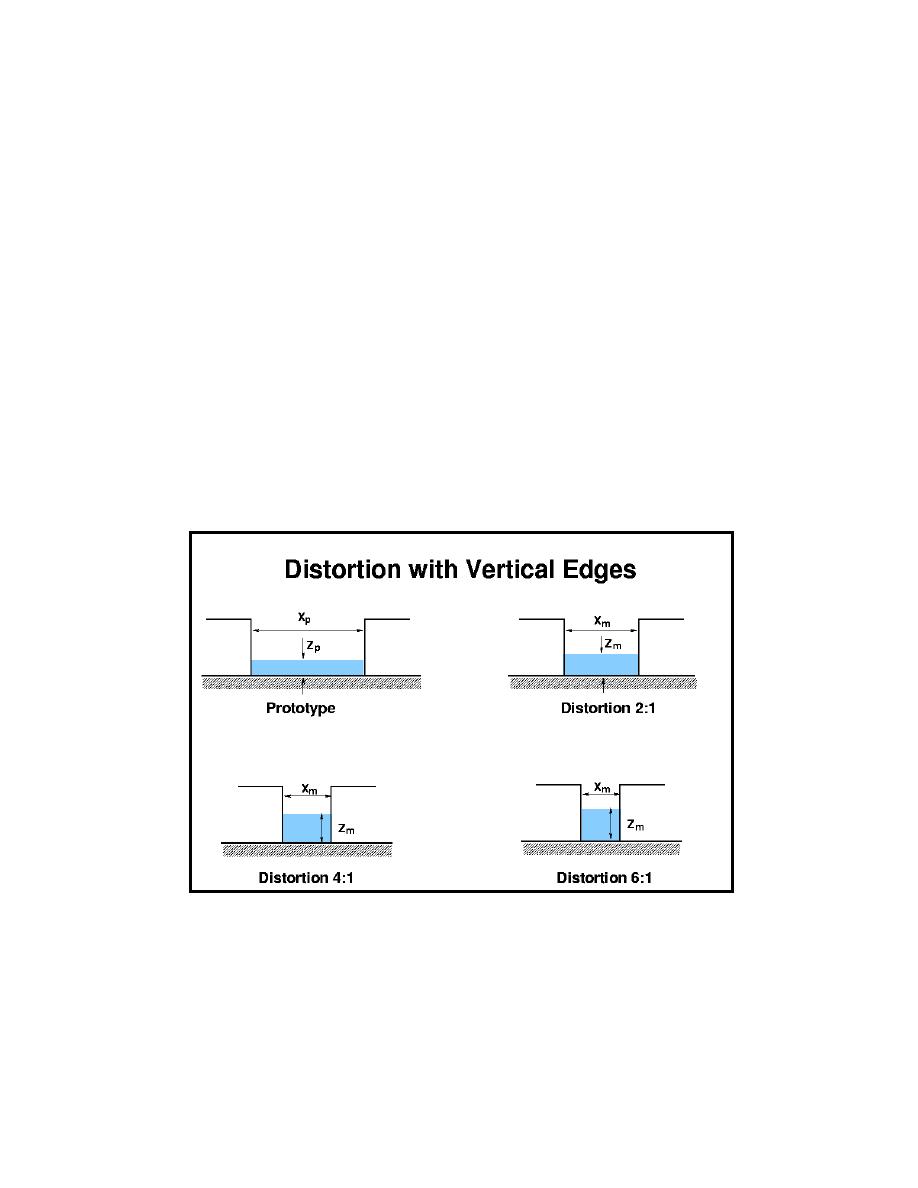
After a prototype test case was established and the velocity field measured,
different distorted models of the prototype case were also tested and the
velocities compared. The relative distortion from prototype can be seen in
Figure 19. Scaling factors for each test in the series along with relevant values
for discharge and key horizontal (Xp, Xm) and vertical (Zp, Zm) dimensions are
listed in Table 5.
Experiment setup
The planform layout of the experiment on the flow table is sketched in
Figure 20. The prototype consisted of a 300-mm (11.8 in.) gap with vertical
walls having sharp edges cut at a 30 deg angle. Water depth was set at 40 mm
(1.6 in.) and a uniform flow of 1.5 L/sec (3.17 pints/sec) was established. This
flow rate provided an average velocity over the gap cross section of 0.125 m/sec
(0.41 ft/sec). Velocities were measured at mid-depth in a domain directly in
front of the gap. The measurement area (shown shaded on Figure 20) had a
width that was about 120 percent of the gap width and length extending about
two-thirds of the gap width downstream.
Figure 19. Cross sections showing distortion for vertical edge tests
41
Chapter 5 Turbulence Scale Effects Experiments


 Previous Page
