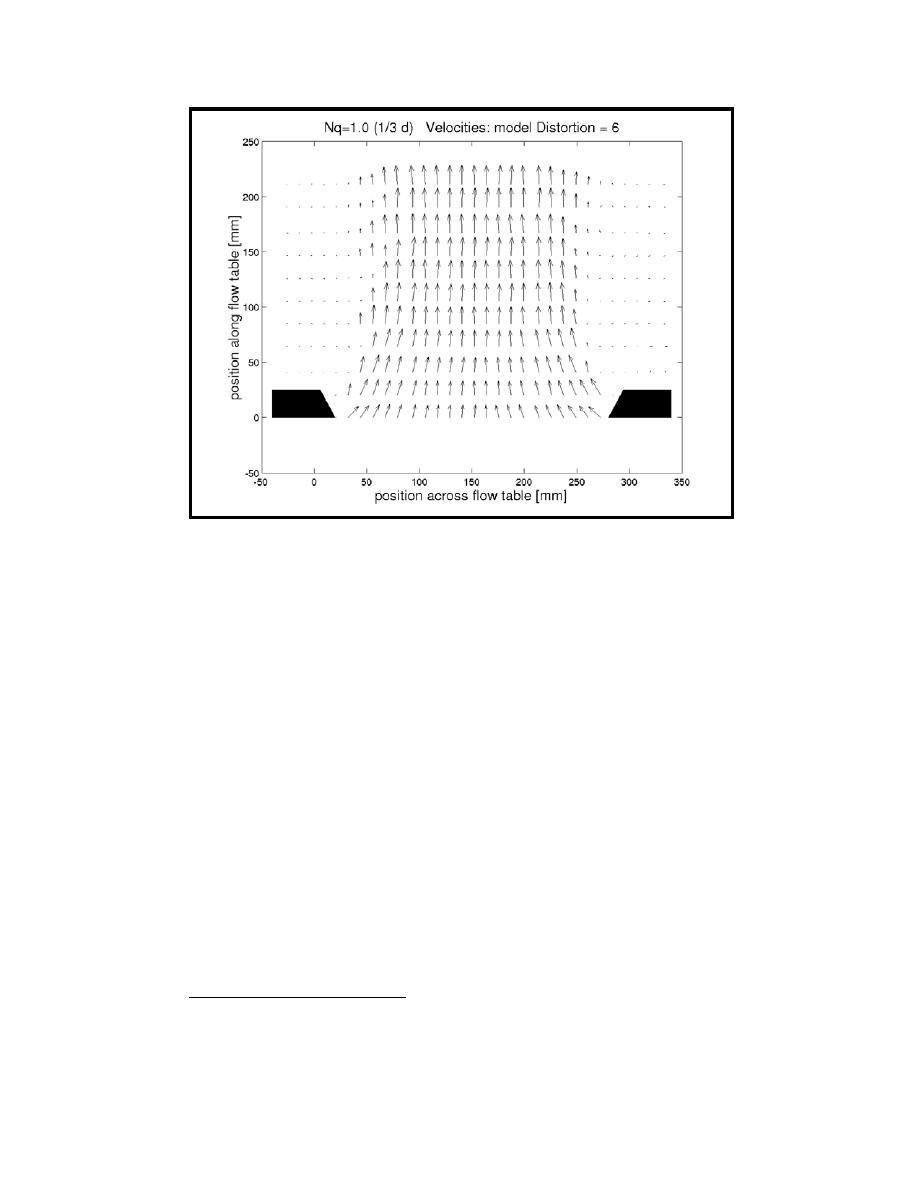
Figure 41. Velocity field at 1/3 d, NQ =1.0, distortion = 6 (Case 3)
Figures 42 and 43 compare prototype velocity vectors with distortion = 6
vectors scaled to prototype size at 2/3 d and 1/3 d above the bottom, respectively.
The distorted model vectors are displaced slightly to the right of the prototype
results. For this higher flow rate, there is much better correspondence higher in
the water column (Figure 42) while closer to the bottom the prototype jet has
spread out more than the distorted model jet (Figure 43). This is a direct
consequence of the milder slope of the gap boundaries in the prototype.
The jet created by flow through the sloping-edge gap increases in width
toward the free surface. Therefore, between two adjacent horizontal layers there
is a strong velocity gradient at the jet boundary in the vertical as well as in the
horizontal plane . In addition to fluid being entrained into the jet in the
horizontal plane, fluid is also entrained upward at the jet boundary due to the
vertical velocity gradient. At, or near, the solid bottom boundary, most of the
fluid needed for vertical entrainment must come from the horizontally adjacent
quiescent region. Mass conservation then causes the jet to expand horizontally.
Higher up in the water column, less fluid is needed from the horizontally adjacent
region to fulfill the vertical entrainment requirement; and consequently, the jet
does not expand as much in the horizontal plane. In the geometrically distorted
model this effect was lessened as the boundary edge became more vertical and
the jet boundary velocity gradient between vertical layers became weaker.
Similar experiments conducted at the slower flow rate showed the same trend,
1
Dye injected into the flow near the jet boundary was observed moving in a spiral-like motion
along the jet boundary in the principal flow direction.
58
Chapter 5 Turbulence Scale Effects Experiments


 Previous Page
