

20
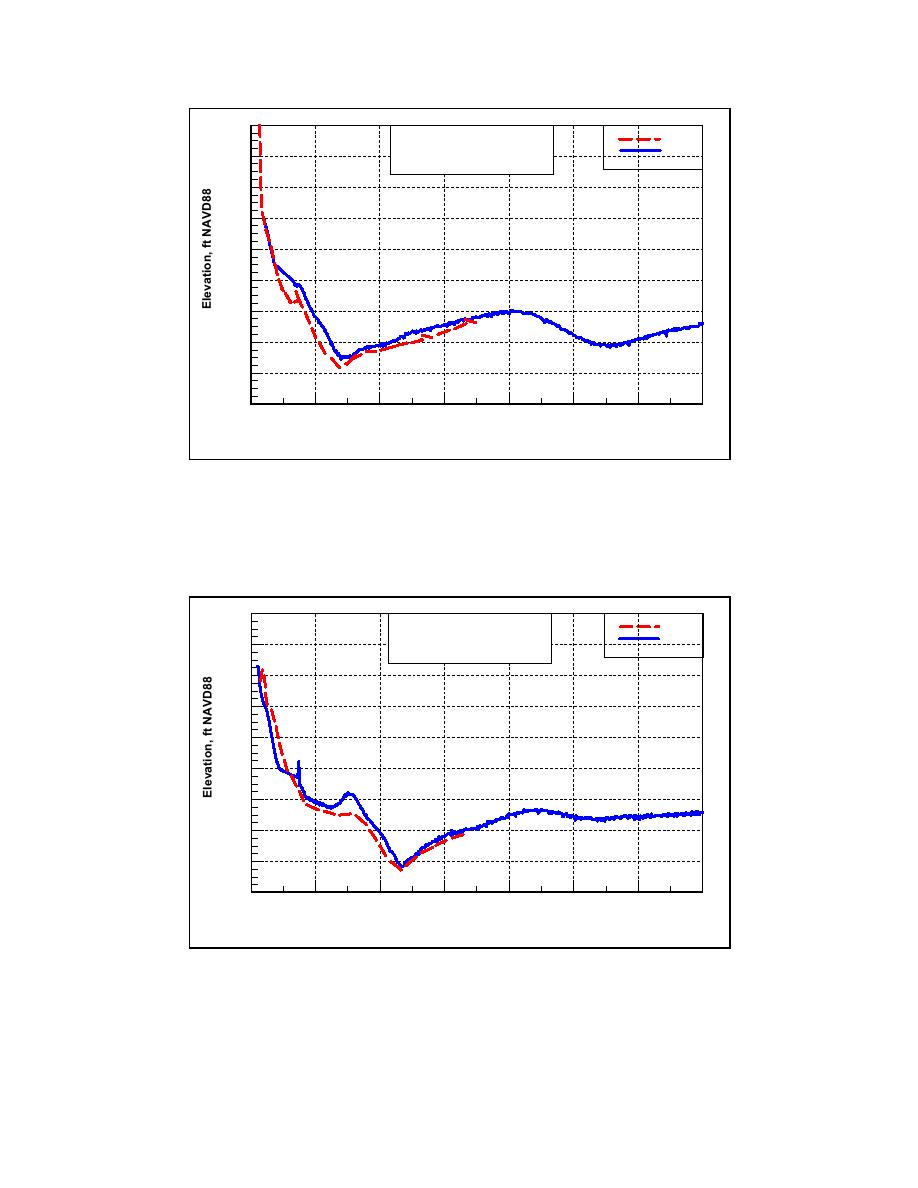
Goldsmith Profile Comparison
1998
Mar 1998 and 6-8 Oct 2002
2002
Line W 4 (Approx. 2,300 ft
15
West of Jetty)
10
5
0
-5
-10
-15
-20
-25
-100
400
900
1400
1900
2400
2900
3400
Distance Across Shore, ft
Figure 4-41c. Beach profile W4, west of Goldsmith Inlet, March 1998 and
6-8 October 2002
20
Goldsmith Profile Comparison
1998
Mar 1998 and 6-8 Oct 2002
2002
Line E 1 (Approx. 400 ft
15
East of Inlet)
10
5
0
-5
-10
-15
-20
-25
-100
400
900
1400
1900
2400
2900
3400
Distance Across Shore, ft
Figure 4-41d. Beach profile E1, east of Goldsmith Inlet, March 1998 and
6-8 October 2002
170
Chapter 4 Morphology Change, and Channel Shoaling and Migration

 Previous Page
