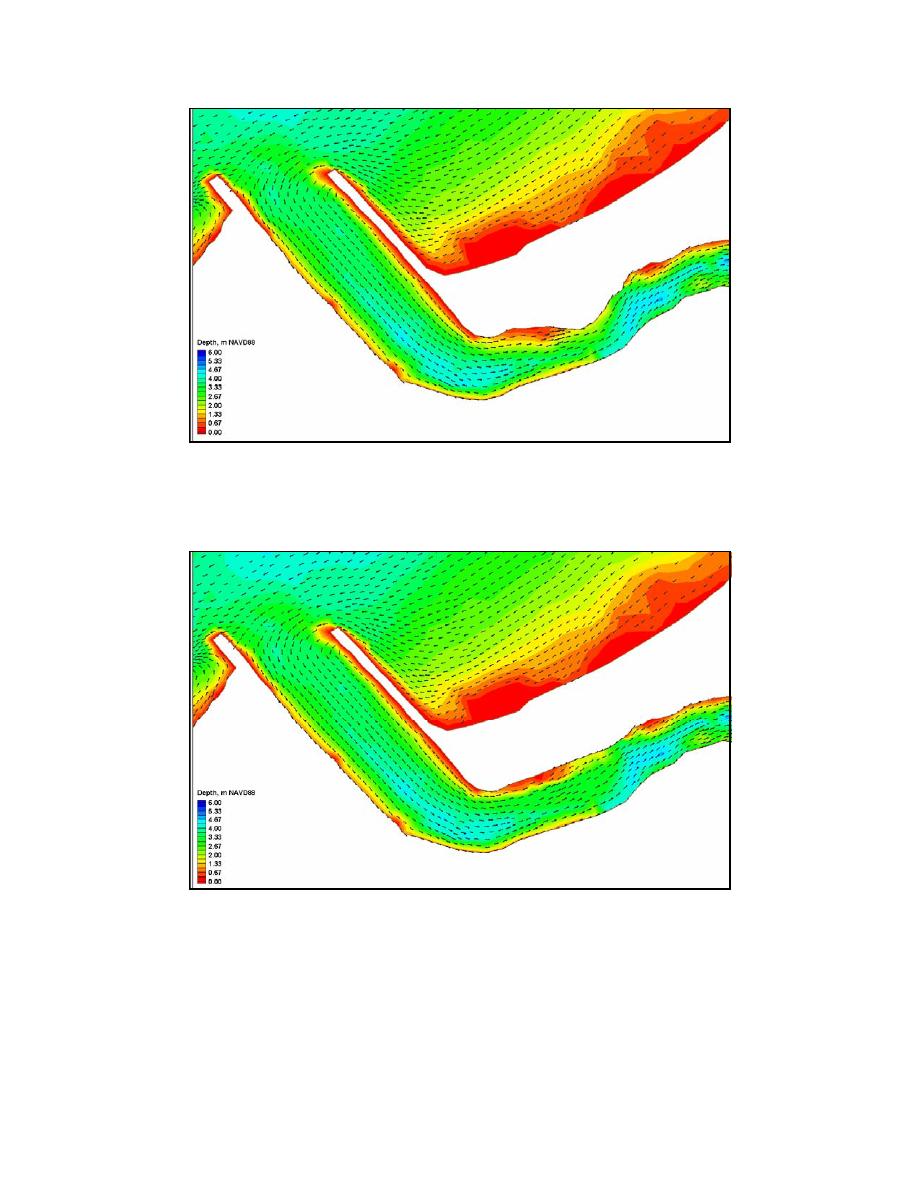
Figure 5-11e. Near-maximum flood-tide velocity and depth, Mattituck Inlet pre-
dredging grid
Figure 5-11f. Near-maximum flood-tide velocity and depth, Mattituck Inlet post-
dredging grid
Figure 5-12 focuses on the location of synthetic dredging of the flood shoal,
and current velocity at selected points is plotted in Figures 5-13a through 5-13c.
The dredging of the flood shoal is calculated to reduce current velocity at the area
of strongest flow by approximately 30 percent. The peaks of both ebb and flood
current are reduced.
225
Chapter 5 Circulation Analysis


 Previous Page
