14. Sand bypassing at Mattituck Inlet appears to occur through a combination of
tidal bypassing and bar bypassing.
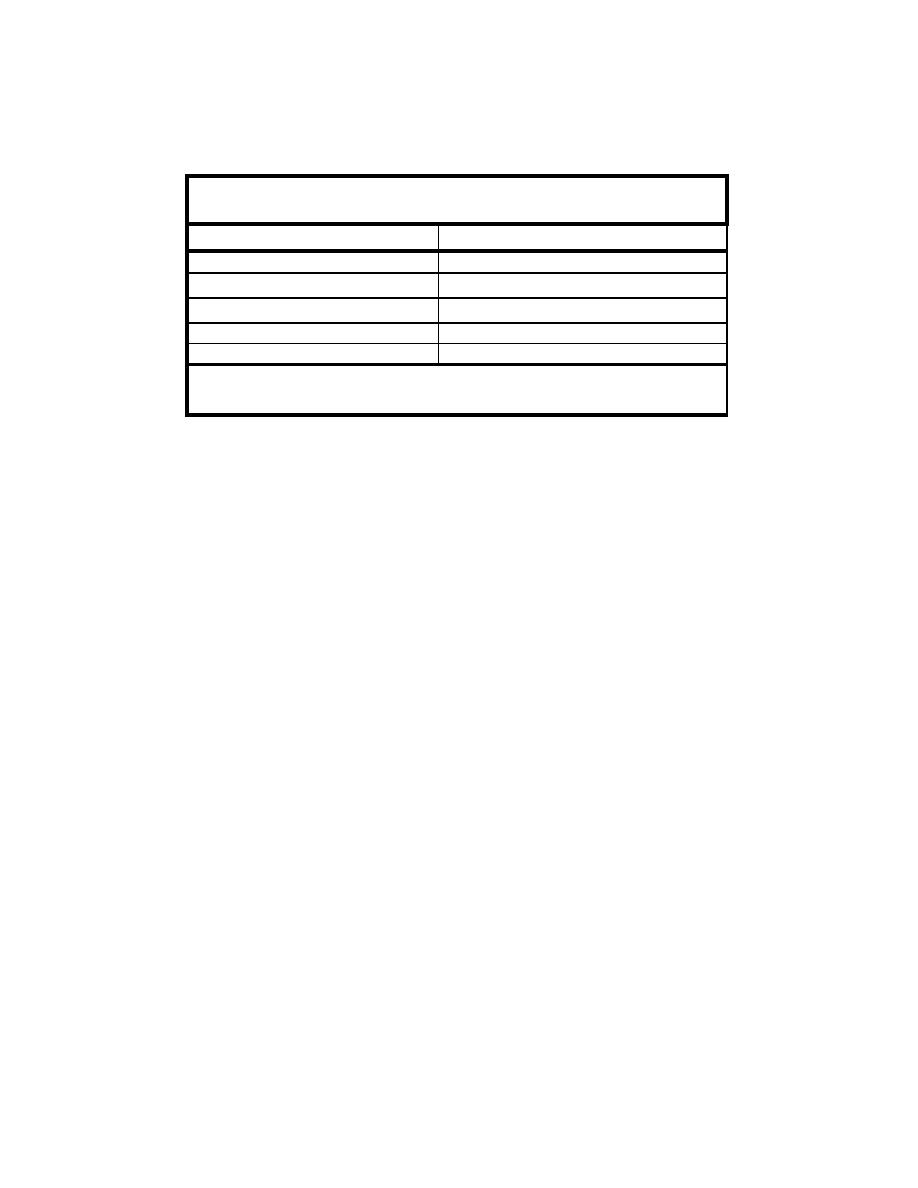
Table 6-3
Mattituck Inlet r Ratio and Associated Physical Quantities
Quantity
Mattituck Inlet
Tidal range (ft)
6.0
7.2 10
Surface area (sq ft)
6
4.32 10
Tidal Prism (cu ft)
7
1
Longshore transport rate (cu yd)
15,000 -25,000
r ratio
64-107
1
Range in longshore sediment transport rate accounts for estimated range in east-directed
transport, material directed to the offshore by the west jetty, and efficiency of the present east jetty to
block sediment directed at the inlet from the east.
The relatively short distance between the jetties, promotes scouring flow in
the channel (small W/D ratio). For Mattituck Inlet, W/D = 43, calculated by
dividing the width of the inlet between the two jetties (400 ft) by the measured
hydraulic radius (9.3 ft). Jarrett (1976) notes that inlets with small W/D ratios
(W/D <100) are hydraulically efficient.
Mattituck Inlet channel cross-sectional area stability
The Channel Equilibrium Area (CEA) model (Seabergh and Kraus 1997)
creates an Escoffier stability curve for a given inlet and was applied to examine
stability of Mattituck Inlet. The Jarrett (1976) relation for dual-jettied inlets on
the Atlantic coast was selected for the analysis, of which Mattituck Inlet fits well
to the trend (Figure 6-2). The one-dimensional CEA model is calibrated by
inputting the dimensions of the inlet and bay from which the hydrodynamics of
the inlet are calculated. The CEA model requires the tidal amplitude at an inlet,
which is half the tidal range.
CEA-calculated water level and velocity are then compared to measurements
at the inlet. Figure 6-3 plots measured and calculated water levels offshore of
Mattituck Inlet, and Figure 6-4 plots measured and calculated water levels for
within the inlet. The comparison period 5-7 October 2002 was selected because
the measurement range was nearly equal to the spring tide range as reported by
the NOS (6.0 ft) (Chapter 3).
Table 6-4 summarizes the physical quantities that served as input to calculate
the equilibrium channel area of Mattituck Inlet. The minimum cross-sectional
area of 1,600 sq ft was derived from the cross sections produced from the
bathymetry survey of 6-8 October 2002. The cross section used, cross-section 9,
is shown in Figure 3-20c. Cross-section 8 appears to have a smaller area, but
was not selected because of inadequate survey coverage. The location of this
transect, at the main area of shoaling, is shown in Figure 3-19.
272
Chapter 6 Inlet Morphology and Stability


 Previous Page
