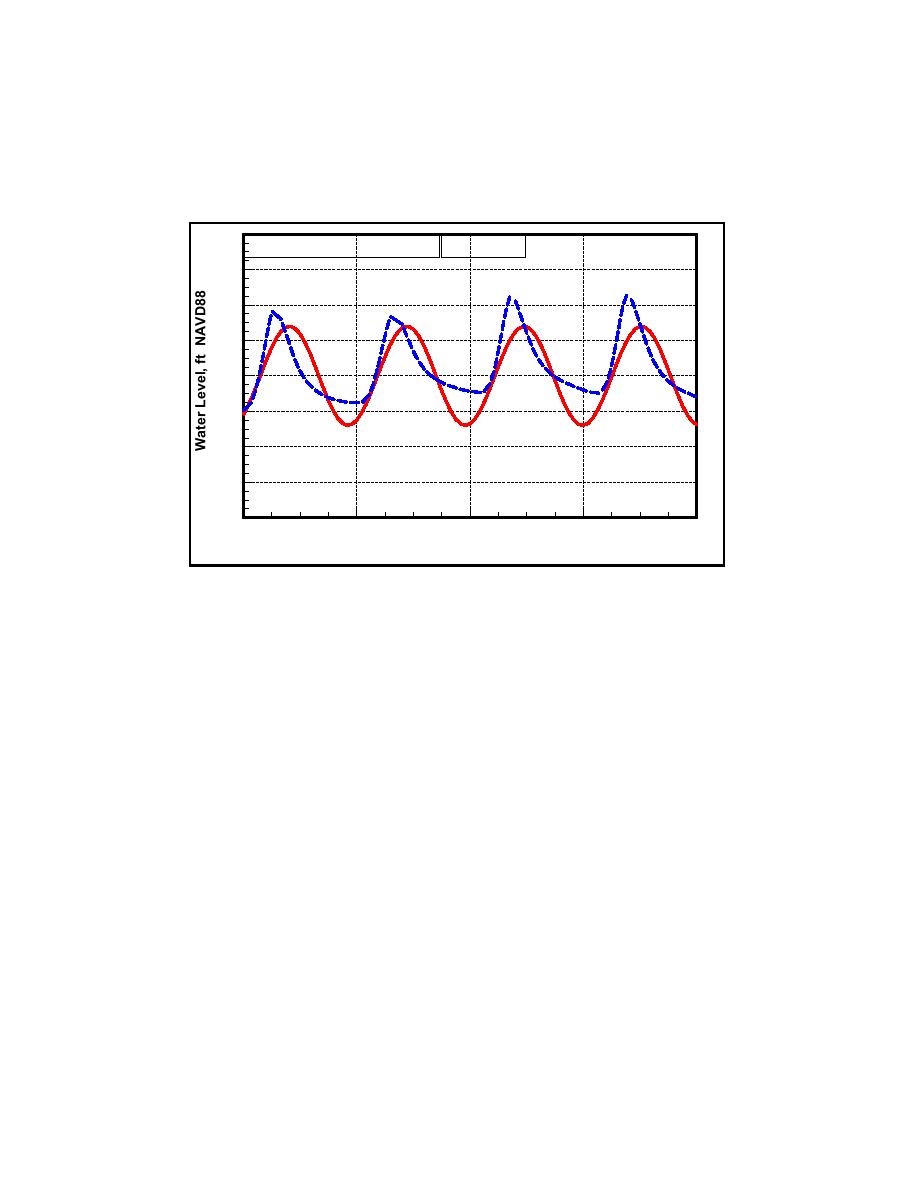
Figure 6-7 plots the measured water level and water level as calculated with
the CEA model for Goldsmith Inlet. The CEA model cannot reproduce the
asymmetry of the observed signal (as discussed in Chapter 4). The model can
still give an estimate of stable channel cross-sectional area if the amplitudes
correspond in the calibration.
4
___ Calculated
Goldsmith Pond Water Level
- - - Measured
3
2
1
0
-1
-2
-3
-4
1200
2400
1200
1200
2400
5 October
6 October
7 October 2002
GMT
Figure 6-7. Goldsmith Pond water-level measurements and calculations by
CEA model
Figure 6-8 shows the calculated maximum velocity curve and the calculated
equilibrium velocity curve for Goldsmith Inlet. The empirical relation for small
inlets developed by Byrne et al. (1980) predicts an equilibrium cross-sectional
area of 109 sq ft for Goldsmith Inlet, and their empirical equation with the CEA
Escoffier analysis gives a stable channel cross section of 114 sq ft. These
calculations are close to value of the minimum channel cross-sectional area of
80 sq ft obtained from the October 2002 survey.
Figure 6-9 plots the tidal prism and channel area relation for Goldsmith Inlet
with data of the inlets studied by Byrne et al. (1980) and Simpson (1976). The
Goldsmith Inlet data points conforms well with the trend of the small Chesapeake
Bay inlets. The two Puget Sound inlets studied by Simpson (1976), Lagoon
Point Inlet and Hancock Lake Inlet, are included because they are similar to
Goldsmith Inlet in being small, gravelly inlets. The inlets studied by Simpson
(1976) were not protected by jetties.
280
Chapter 6 Inlet Morphology and Stability


 Previous Page
