84
A. Bayram et al. / Coastal Engineering 44 (2001) 7999
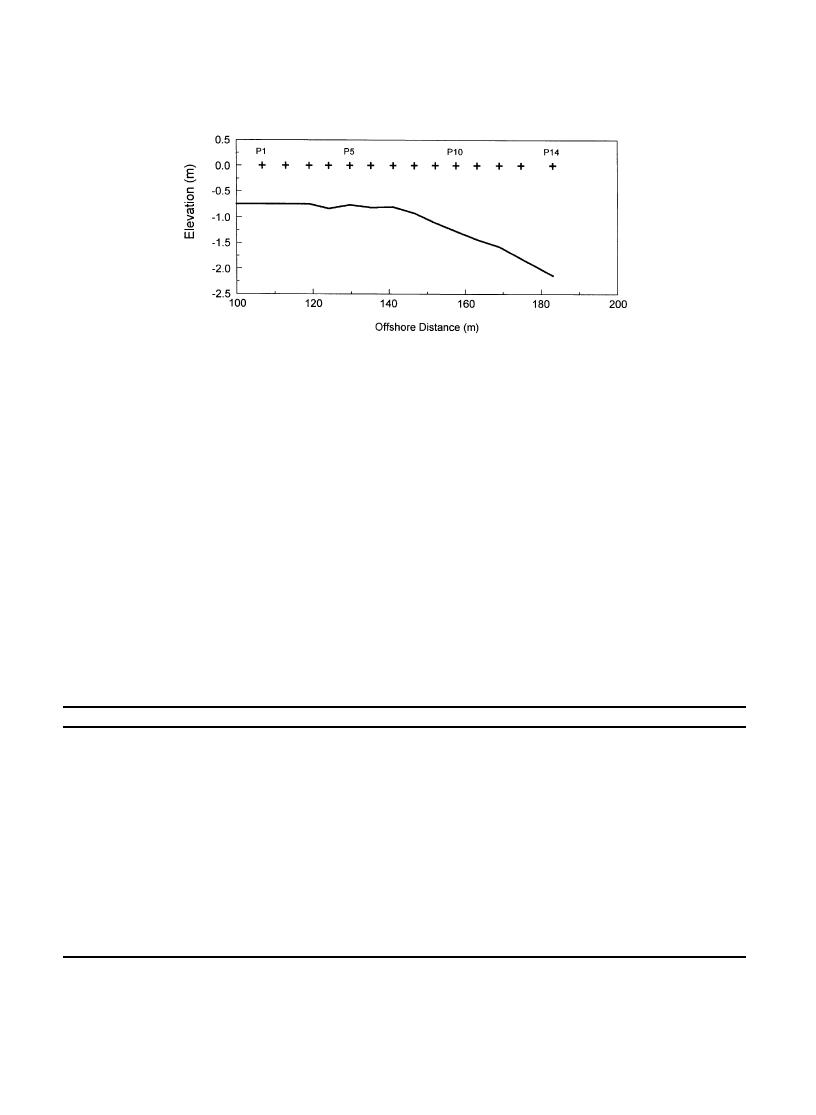
Fig. 1. Bottom profile surveyed along the measurement transect on September 6, 1985 (DUCK85 experiment).
on September 19, 1986. In contrast to the DUCK85
Waves and currents were measured in the same
experiment, barred profiles occurred several times
manner as for DUCK85. The wave conditions during
during the SUPERDUCK experiment, although the
the experiment were characterized as long-crested
two runs presented here involved shelf-type profiles.
swell (Tp in the range 6 13 s) with a majority of
the waves breaking as plunging breakers. The wave
3.3. SANDYDUCK surf zone sand transport experi-
height (Hrms) at the most seaward pole varied between
ment
0.3 and 1.6 m during the experiment. A steady off-
shore wind (6 7 m/s) was typically present during the
The SANDYDUCK experiment was conducted in
measurements. The mean longshore current speeds
the same location as the DUCK85 and SUPERDUCK
measured were in the range of 0.1 0.7 m/s. During
experiments (Miller, 1998). SANDYDUCK included
the experiment, the seabed elevation at each of the
several major storms, complementing the measure-
photopoles was surveyed once a day and Fig. 2
ments made during DUCK85 and SUPERDUCK.
shows, as an example, the surveyed bottom profile
Table 2
Beach and wave characteristics for runs selected from the DUCK85, SUPERDUCK, and SANDYDUCK experiments for comparison with
sediment transport formulas
Date
Profile type
Hrms (m)
Tp (s)
Dref (m)
Vmean (m/s)
Sept. 5, 1985, 09.57
Shelf
0.50
11.4
2.14
0.11
Sept. 5, 1985, 10.57
Shelf
0.46
11.2
1.80
0.17
Sept. 5, 1985, 13.52
Shelf
0.54
10.9
2.19
0.17
Sept. 5, 1985, 15.28
Shelf
0.46
11.1
1.94
0.22
Sept. 6, 1985, 09.16
Shelf
0.48
12.8
1.40
0.30
Sept. 6, 1985, 10.18
Shelf
0.36
13.1
2.14
0.29
Sept. 6, 1985, 13.03
Shelf
0.42
10.1
2.43
0.22
Sept. 6, 1985, 14.00
Shelf
0.36
11.2
2.34
0.18
Sept. 16, 1986, 11.16
Shelf
0.60
10.1
2.20
0.20
Sept. 19, 1986, 10.16
Shelf
0.59
10.1
2.66
0.17
March 31, 1997
Bar
1.36
8.0
6.70
0.49
April 1, 1997
Bar
2.92
8.0
6.82
1.10
October 20, 1997
Bar
2.27
12.8
6.44
0.53
February 04, 1998
Bar
3.18
12.8
8.59
0.60
February 05, 1998
Bar
2.94
12.8
6.83
0.45
Hrms = root-mean-square wave height at the most offshore measurement point; Tp = peak spectral period; Dref = water depth at the most offshore
measurement point; Vmean = mean longshore current velocity in the surf zone.


 Previous Page
