A. Bayram et al. / Coastal Engineering 44 (2001) 7999
87
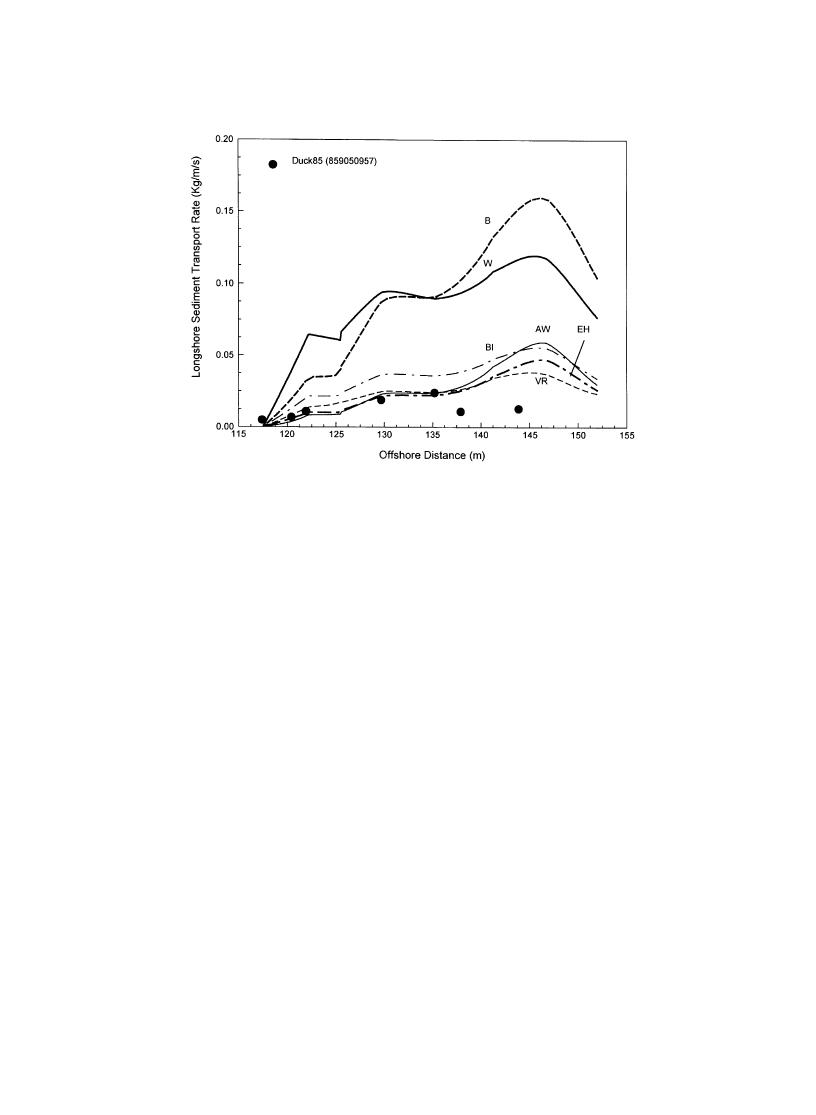
Fig. 4. Comparison between calculated and measured cross-shore distribution of longshore sediment transport rate for Run 859050957 from the
DUCK85 experiment.
from year/month/day/time, in accordance with Kraus
graded sediments large suspension modifies the veloc-
et al., 1989). It is noted that the AW, EH, and VR
ity distribution so that the assumptions underlying the
formulas yield good predictions within the same order
formula are not satisfied (Engelund and Hansen,
of magnitude as the measured data, at least in the
1967). Another reason for the discrepancy might be
inner part of the surf zone. Contrarily, the B, BI, and
the relatively strong influence of the predicted rough-
W formulas give significantly higher transport rates
ness on the transport rate that the EH formula dis-
than the measurements, especially B and W. Some
plays. Run 859051528 (see Fig. 5) indicated a
overestimation is expected for the B and BI formulas
bimodal distribution with a large peak in the outer
because they do not take into account the threshold of
surf zone (at around 145 m) and a small peak in the
sediment motion in their original formulations,
inner surf zone (at around 125 m). In general, the
although this simplification would not account for
formulas fail to correctly predict this shape, especially
the large deviations found for the B formula. Bijker
the shoreward peak. This peak is probably a function
(1971) pointed out that his formula tended to over-
of additional breaking and current generation close to
estimate the transport rate using the recommended
the shoreline. Because no current measurements were
value on the main coefficient.
available here, extrapolation was employed, implying
Figs. 5 and 6 show calculated and measured trans-
that some portion of the discrepancy is probably
port rates for the experimental runs 859051528 and
caused by the uncertainty in the input data rather than
859060916, respectively. All formulas except B and
the formulas themselves.
W predicted longshore transport rates at the correct
During Run 859060916 the most seaward trap was
order of magnitude, although the EH formula some-
located outside the surf zone and a relatively small
what underpredicted the transport rate. Bearing in
amount of sand was collected in it (Fig. 6). Thus, there
mind that the sediment has a d50 of approximately
is clear evidence that the longshore transport rate
dropped off steeply seaward of the break point.
0.18 mm at the site, the discrepancy between the EH
Predictions by the AW, BI, EH, and VR formulas
formula and the measured rates might be due to
were in satisfactory agreement with the measured
limitations in the derivation of the formula. For fine-


 Previous Page
