

A. Bayram et al. / Coastal Engineering 44 (2001) 7999
89
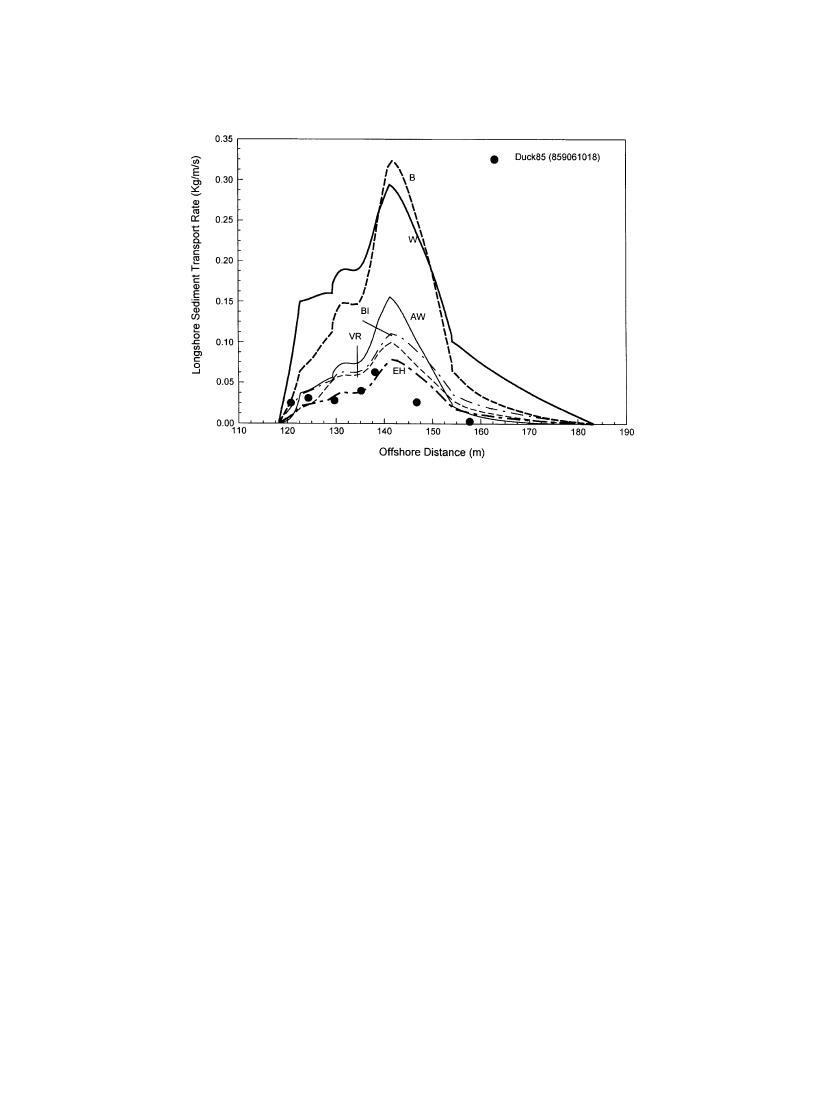
Fig. 7. Comparison between calculated and measured cross-shore distribution of longshore sediment transport rate for Run 859061018 from the
DUCK85 experiment.
However, only two runs had sufficient information on
In general, based on the calculation results from the
the local hydrodynamics to allow comparison with the
DUCK85 runs summarized in Table 2, the B, BI, and
predictive formulas. Figs. 8 and 9 show the measured
W formulas overestimated the transport, whereas the
and computed longshore transport rates for Runs
AW, EH, and VR formulas yielded overall good pre-
8609161116 and 8609191016, respectively. For Run
dictions. Most of the formulas produced cross-shore
8609161116, similar conclusions can be drawn as for
distributions that were more or less in agreement with
the earlier discussed DUCK85 runs concerning all the
the measured distributions, although some calibration
formulas. The B and W formulas overestimate the
factors might be needed to achieve quantitative agree-
transport rates, whereas the AW, BI, EH, and VR
ment. The observed discrepancy between the meas-
formulas produce distributions that are in good agree-
urements and predictions using standard coefficient
ment with the measurements, at least shoreward of the
values is attributed to several factors: all formulas rely
main break point. A relatively small amount of sand
on a considerable number of parameters and coeffi-
was collected outside the surf zone (break point
cients, where the values were typically determined
located at approximately 170 m; see Fig. 8), again
from situations not completely representative for the
displaying the sharp drop in the sand transport rate
field (e.g., laboratory, river environment). Also, the
occurring seaward of the break point. For Run
transport is sensitive to the estimated bottom rough-
8609191016 (Fig. 9) the formulas showed an agree-
ness, which is a difficult quantity to determine, there-
ment with the data in accordance with the previous
by introducing significant uncertainty into the cal-
runs, although the over-predictions were relatively
culations.
more marked outside the surf zone for this run.
4.2. Comparisons with SUPERDUCK data
4.3. Comparisons with SANDYDUCK data
Four runs were conducted during the SUPER-
Five experimental runs from the SANDYDUCK
DUCK experiment where the cross-shore distribution
experiment (Miller, 1998) were available for compar-
of the longshore sand transport rate was measured.

 Previous Page
