

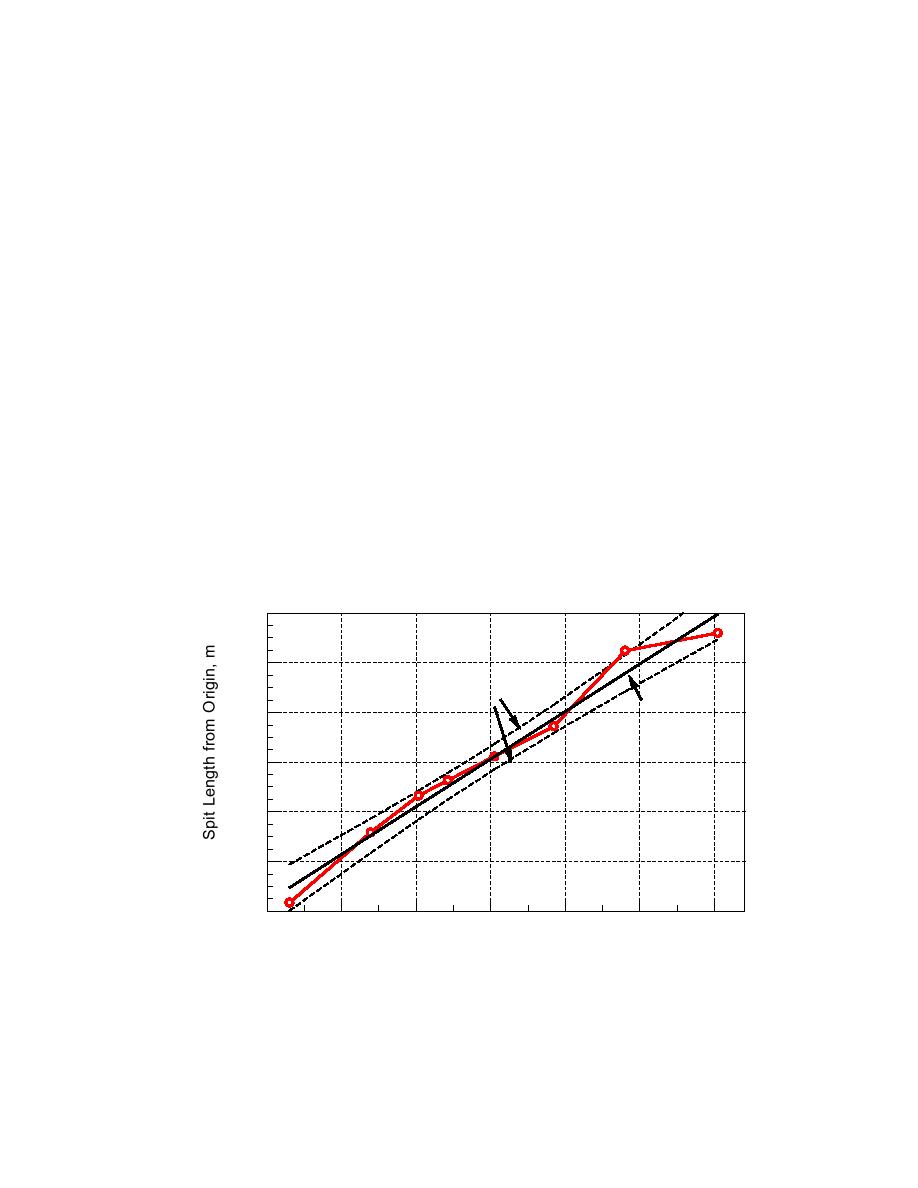
The position of the distal end of the spit as determined from eight aerial
photographs taken from 26 July 1977 to 7 December 1984 is plotted in Fig. 7,
together with a linear regression line and 95% confidence limits. For the period
plotted, it is evident that the North Beach spit grew in an unrestricted manner as
described in the analytic model. The predominant direction of longshore transport is
to the north, determined by predominant wind out of the southeast and by basin
configuration, limiting the fetch to the north (Fig. 6).
Spit width from selected aerial photographs is plotted in Fig. 8. Beyond an
elongation distance of about 500 m, the spit begins to spread as its platform reaches
the causeway. The data exhibit scatter because of the occasional presence of
washover fans. Although the astronomical tidal range in Corpus Christi Bay is
small, weather fronts and hurricanes raise the water level and allow sand on the spit
to be spread across shore by waves. For, example, in August 1980, Hurricane Allen
inundated the spit for several hours (Kieslich and Brunt 1989). With time, spit width
tends to increase gradually, as expected from the occurrence of small inundation
events. As a short-term (several-year) value, spit width of W =20 m is taken to
represent an assumed symmetric trapezoidal cross-section.
No profile data were available for the spit, but beach-fill-monitoring data are
documented in Goldston Engineering, Inc. (1983), as in Fig. 9. The data show the
berm elevation as about 0.9 m above MTL, and the bay bottom is flat at about 2.6 m,
giving a total active depth of movement of 3.5 m.
700
North Beach Spit
Corpus Christi
600
95% Confidence Limits
Linear
500
Regression
400
300
200
100
08/28/76
01/10/78
05/25/79
10/06/80
02/18/82
07/03/83
11/14/84
Date (1976 - 1984)
Fig. 7. Elongation of the spit at Corpus Christi (North) Beach.
Kraus
11

 Previous Page
