b
g
WD xC - xo
τ=
(6)
$
Q
For the numbers in the previous example, and with a lateral extension of 100 m,
we have τ = (100 m x 5 m x 100 m)/(100,000 m3/year) = 0.5 year. This appears to be
a reasonable time scale for representing the motion of an organized sediment body.
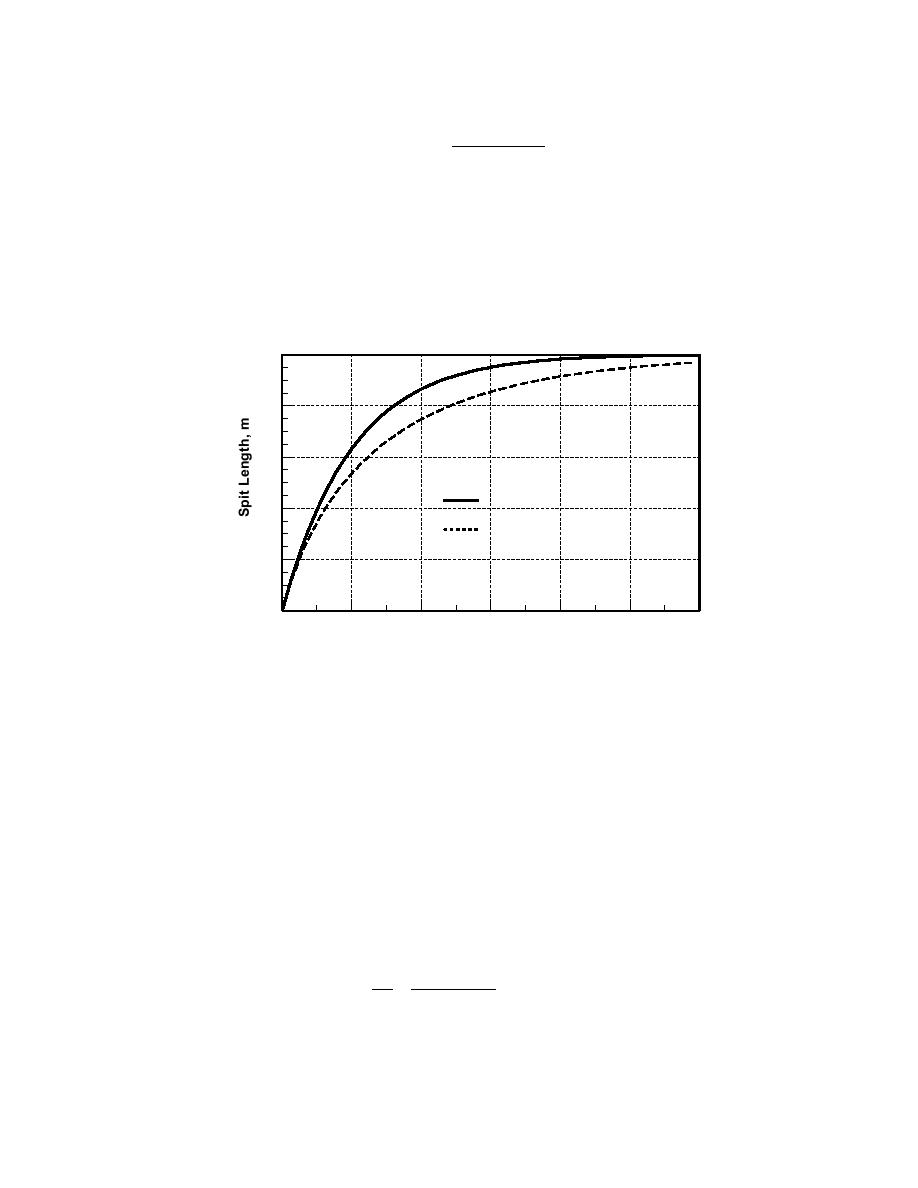
For this value of τ, and with xo = 0 without loss of generality, Eq. 5 is plotted in
Fig. 4 as the line labeled "Constant depth" for constant depth of active movement.
As seen in Eq. 5, the rate of spit growth decreases exponentially as the spit
approaches the channel.
100
80
60
Constant depth
40
Increasing depth into channel
20
0
0.0
0.5
1.0
1.5
2.0
2.5
3.0
Elapsed Time, years
Fig. 4. Prediction of spit elongation by analytical model.
Example 3: Spit Growth Restricted by Inlet Channel and with Increasing D
This situation is the same as in the previous example, but is made more realistic
by accounting for the depth of the channel. That is, the depth of active movement is
assumed to increase with approach of the spit to the channel, i.e., the inlet channel
thalweg is deeper than the ambient nearshore contours. For simplicity in obtaining
an analytical solution, the depth is taken to increase linearly with fixed slope from
some depth Do distant from the channel (at xo). So,
D = Do + Sx
(7)
where S = dD/dx = slope into the channel. The governing equation (Eq. 1), modified
to include the x-dependence of D, becomes
b
g
dx
1
=
Qin - Qout
b
g
(8)
dt W Do + Sx
Kraus
7


 Previous Page
