

where yo is the cross-shore coordinate at the starting point of calculation located far
up drift and may be taken to be zero in the present discussion. Fig. 5 plots motion of
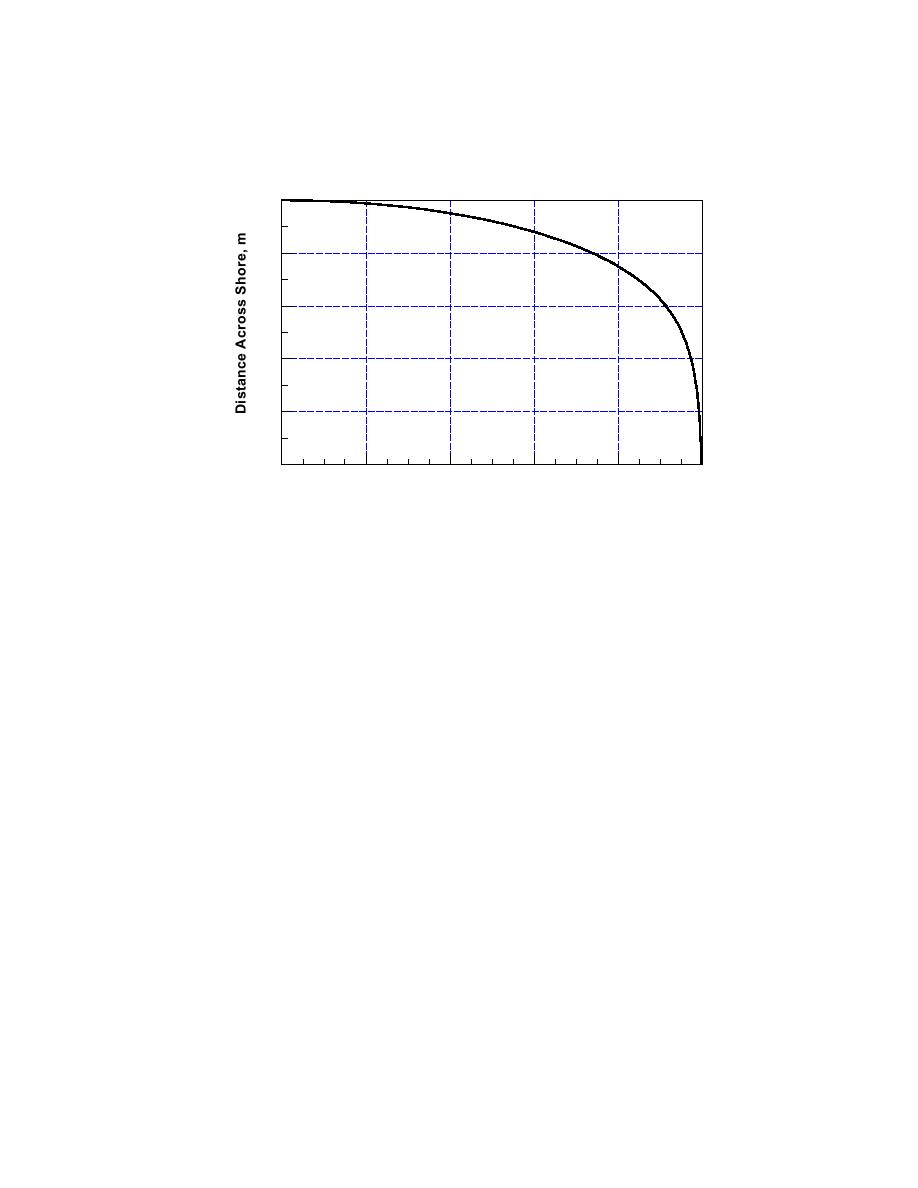
the tip spit, xS(t), yS(t) as for the previous example and with vC = 5 m/year.
0
-5
Simulation for Recurving Spit
Elapsed Time, 5 years
-10
-15
-20
-25
0
20
40
60
80
100
Distance Alongshore, m
Fig. 5. Simulation of spit curving.
Discussion of Analytical Model Examples
The analytical model reveals the dependence of spit growth on fundamental
geometric parameters, longshore sand transport rate, and time. A characteristic time
constant τ is was obtained. Examples 2 and 3 demonstrate that the location of the tip
of a spit at an inlet tends to be stable because material is swept from it by the channel
current and because a channel tends to be deeper than the spit platform. Spit
recurving was also reproduced in a simple way. The analytic approach is capable of
yielding quantitative information, trends, and insight in through the compact form of
simple equations. Generalization to complex dependencies is readily implemented
numerically.
Trends of predictions are next examined through analysis of data from the field
and from a physical model.
SPIT AT CORPUS CHRISTI BEACH
Corpus Christi Beach, traditionally called North Beach by the residents, is a bay
shore, north-south trending beach located on the western side of Corpus Christi Bay,
Texas (Fig. 6). The beach terminates at the north jetty of the Port of Corpus on its
southern side and is now terminated by a groin 2.3 km to the north on its northern
side. Corpus Christi Beach is a popular urban recreational area that began eroding
notably after a series of hurricane landings in the early 1900s.
Starting about October 1977 and finishing in March 1978, the U.S. Army Corps
of Engineers reconstructed the beach as a novel two-layer beach fill consisting of
382,000 m3 of hydraulically-dredged silty sand covered by 300,000 m3 of coarser
Kraus
9

 Previous Page
