1200
β = 80
1000
β = 60
1000
800
800
2000 m
β = 40
600
600
1000 m
400
200
500 m
400
β = 20
0
200
-200
Shoreline for β = 20
Shoreline for Fixed Radius
Focus of Parabola
-400
Focus of Parabola
0
-1500
-1000
-500
0
-500
0
Distance Alongshore, m
Distance Alongshore, m
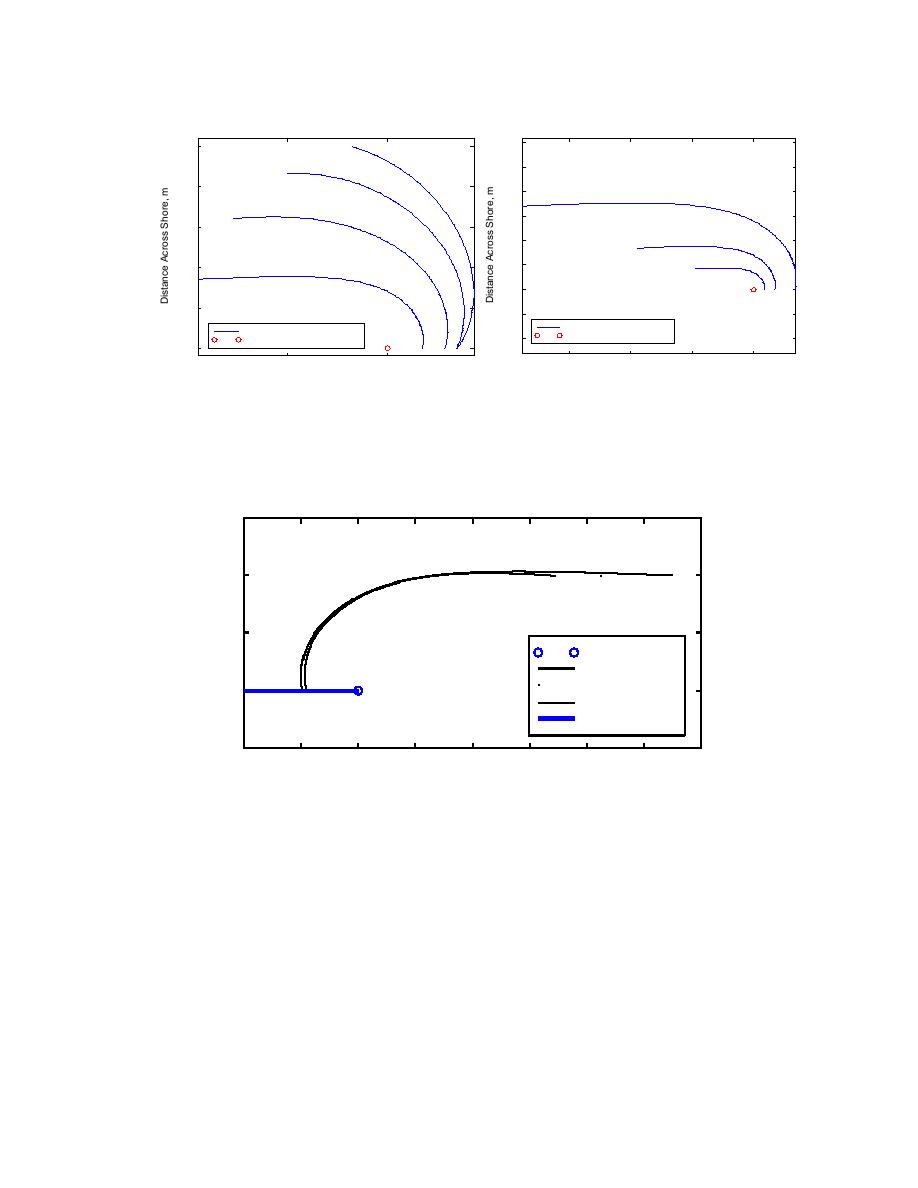
Fig. 6. Parabolic shape for selected values of
Fig. 5. Parabolic shape for selected values
R0 (β = 20 .
)
of angle β (R0 = 1,000 m).
150
100
50
Focus
β = 20
β = 25
0
β = 30
Headland
-50
-100
-50
0
50
100
150
200
250
300
Fig. 7. Sensitivity of parabolic shape to selection of control point location.
If the location of the focus is known, and the wave crests are parallel to the x-axis,
the values of R and ? can be computed for each data point. For each candidate value of
the angle , the right-hand side of Eq. 3 can be computed and, therefore, a value of Ro
estimated for each point. The selected combinations of focus location, angle of rotation
of the local coordinate system to the absolute coordinate system, Ro, and are computed
such that the radial rms error achieves a minimum.
Moreno & Kraus
8


 Previous Page
