2.0
H
1.5
2H
0.5H
1.0
0.5
0.0
B
C
A
-0.5
0
2
4
6
8
10
12
14
16
Distance Alongshore (m)
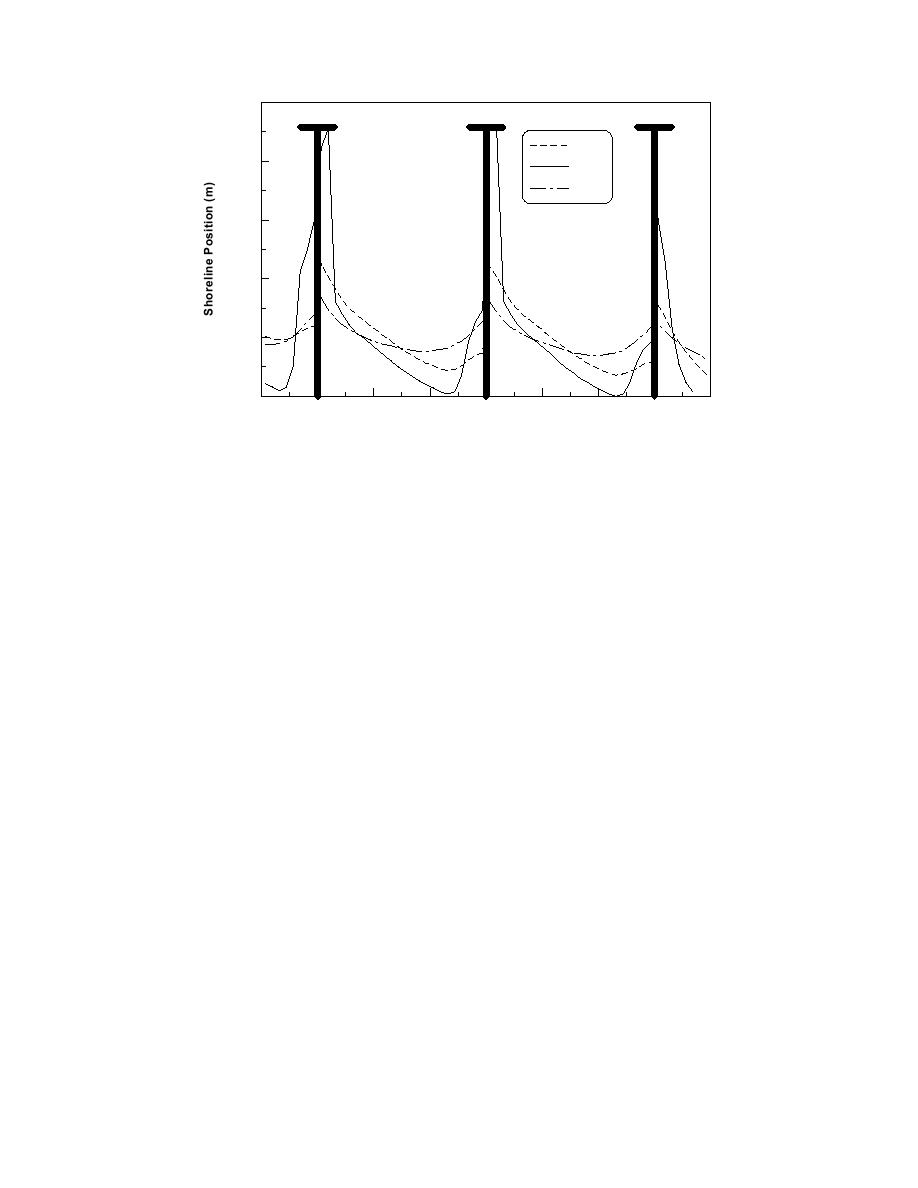
Fig. 6. Calculated shoreline response for varying wave height.
Tombolo Development Keeping all other values as those describing the
physical model, the wave height was doubled in two GENESIS runs for 40 hr to
illustrate the development of tombolos. In addition, a gated boundary condition
was used, allowing sand to get into the system but not out. The first run was
made for the T-configuration in Case 4, the second for the DBW configuration in
Case 3.
Starting with the measured shoreline after 1 hr in Case 4, a tombolo
developed on the up-drift side of Groin A after an additional 2 hr (Fig. 8). As
shown in the sensitivity analysis above, this tombolo would never have developed
if the boundary had been closed in GENESIS, as it is in the physical model. By
allowing sand to enter over the boundary there sufficient material flowing into the
system to build a tombolo. After 5 hr, all three T-heads developed tombolos on
their up-drift sides.
8


 Previous Page
