

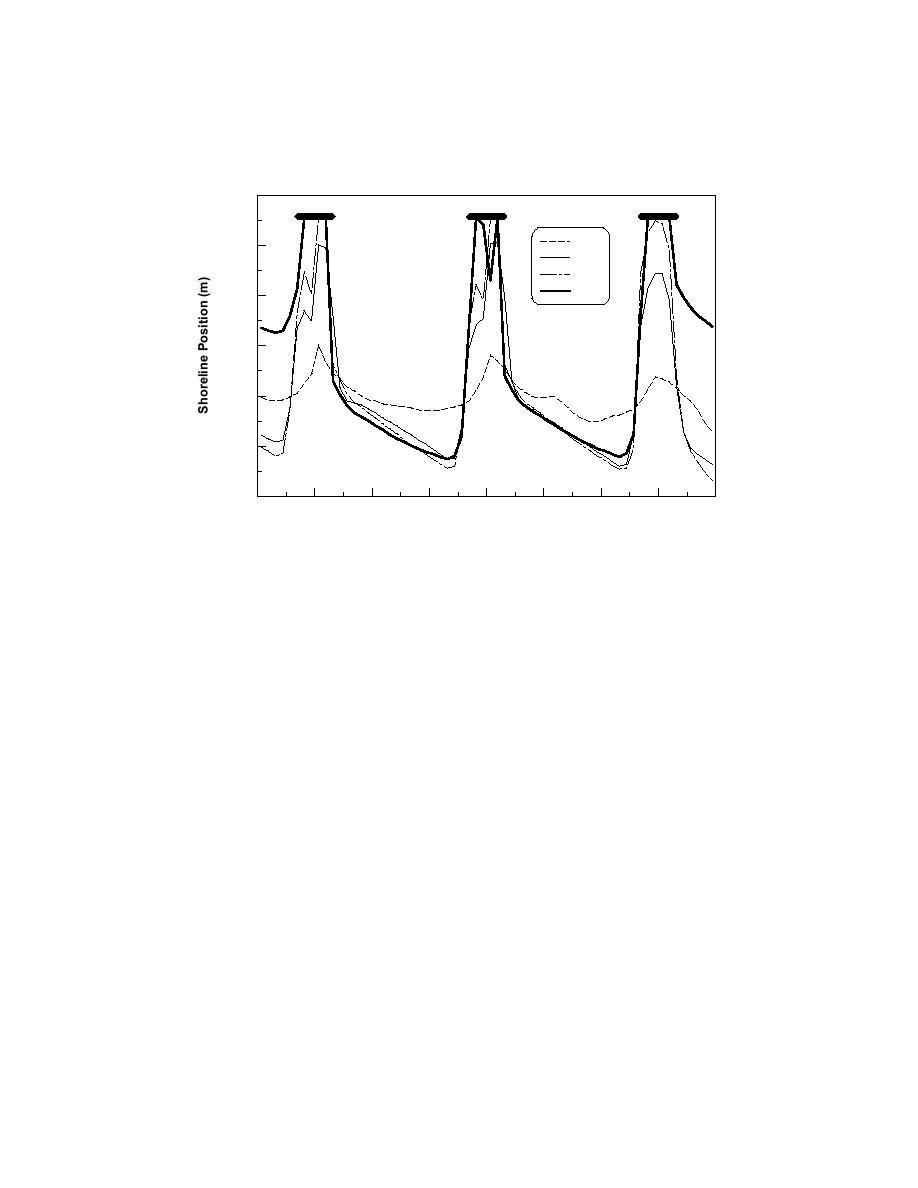
displayed in Fig. 9. After 2 hr, tombolos did not form, as in the T-groin case.
After 5 hr, DBWs A and B developed tonmbolos. At 40 hr, the tombolos had
continued to grow on the down-drift sides. In addition, a considerable amount of
sand accreted between the DBWs and the model boundaries.
2.0
Initial
1.5
2 hr
5 hr
40 hr
1.0
0.5
0.0
-0.5
B
A
C
-1.0
0
2
4
6
8
10
12
14
16
Distance Alongshore (m)
Fig 9. Temporal evolution of tombolos near DBWs.
Calculations for the T-head and the DBW case are shown in Fig. 10. Because
of blockage by the groins, virtually all sand that enters into the model over the
lateral boundaries remains in the area between the lateral groins and the model
boundares throughout the simulation. In the DBW case this sand moved further
into the areas between the structures. Thus, the T-head case shows more sand in
the areas outside the structures, whereas the DBW case shows more sand between
the structures. The total volume is, however, roughly the same for the two cases.
10

 Previous Page
