measured or hindcast wind speed and direction were included as surface wave forcing in
their respective applications.
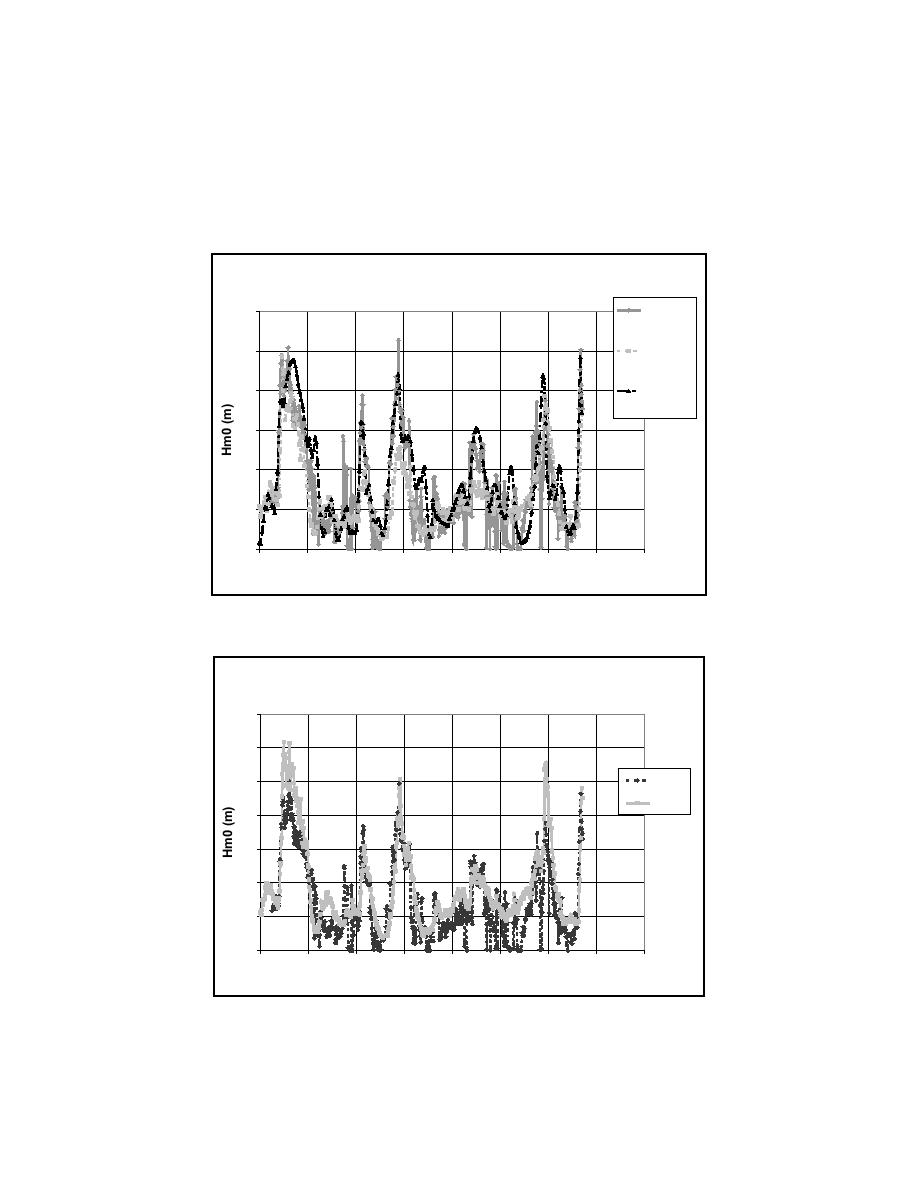
Comparison at Westhampton. To assess the need for a fine-resolution grid in an area
where bottom contours are relatively straight and parallel, a comparison of the results at
Westhampton are presented in Figs. 8 and 9. The plots show a reasonable validation of the
regional STWAVE model (1 nautical mile grid resolution) with NDBC data as input. The
greatest directional discrepancies occur when wave energy is low.
February 1999
50 47
3
(NDBC)
ADV1
2.5
Cut 36
2
47 (WIS)
1.5
1
0.5
0
0
100
200
300
400
500
600
700
800
Hour
Fig. 7. Wave height comparison of transformed waves generated from Buoy 44025 and
hindcast spectra versus measured nearshore waves at Shinnecock Inlet, February 1999.
February 1999
3.5
3
48 53
2.5
NY1
2
1.5
1
0.5
0
0
100
200
300
400
500
600
700
800
Hour
Fig. 8. Wave height comparison of transformed waves generated from Buoy 44025 versus
measured nearshore waves at Westhampton, New York (NY1), February 1999.
8


 Previous Page
