0.4
Hr
Day 1
9
0.3
0.2
10 8
0.1
7
11
6, 12
0.0
1
0
5
4
-0.1
2
-0.2
-0.3
3
-0.4
0
5
10
15
20
25
30
Distance Along Basin, km
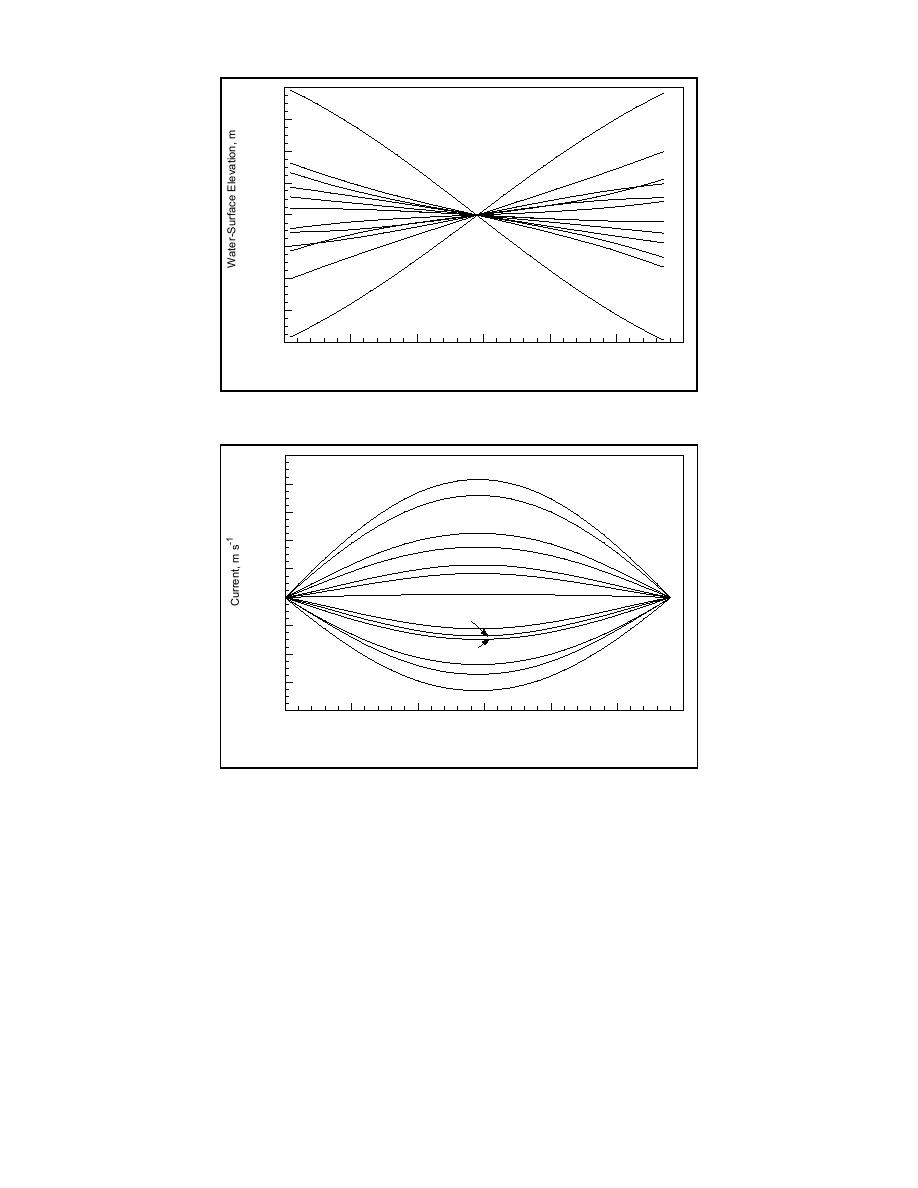
Fig. 4. Selected water levels along the basin, 1-m depth
0.5
Hr 2
Day 1
0.4
10
0.3
12
0
0.2
7
5
0.1
9
0.0
11
1
-0.1
3
4
-0.2
6
8
-0.3
-0.4
0
5
10
15
20
25
30
Distance Along Basin, km
Fig. 5. Selected current velocities along the basin, 1-m depth
To demonstrate other properties of the analytic solution, the depth in the previous
example was changed to h = 2 m. Time series of the water-surface elevation and current
are plotted in Fig. 6 with corresponding spectra in Fig. 7. These are analogous to Figs. 2
and 3 for the situation of h = 1 m. The responses (amplitudes) of both the water level and
current speed are smaller for the greater depth because the wind must move more water.
Also, the first normal mode is now located at 6.60 cpd. As a consequence of the different
normal modes, the time series differ for the two ambient depths.
Action of Bottom Friction in Presence of Sea Breeze
With bottom friction acting, higher-mode frequencies damp more than lower modes.
8
Kraus & Militello


 Previous Page
