F.S. Buonaiuto, N.C. Kraus / Coastal Engineering 48 (2003) 5165
57
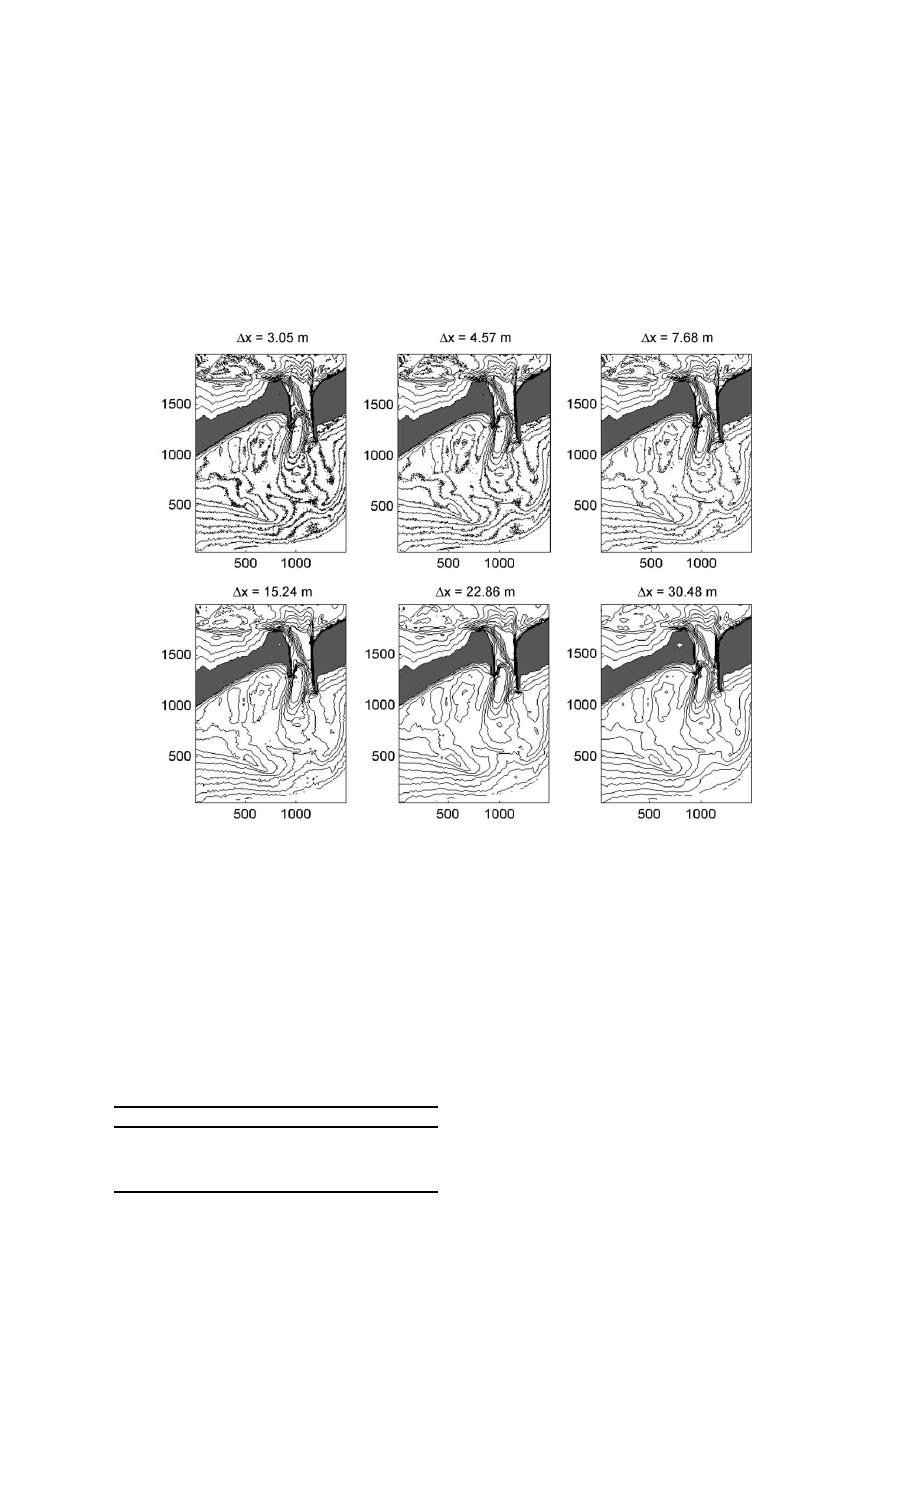
Fig. 3. Bathymetry contours drawn at 1 m interval for selected sampling intervals of the LIDAR data for Shinnecock Inlet, NY, survey of
August, 1997.
each transect. Table 4 summarizes limiting slopes of
inspection of contour maps, and sensitivity of calcu-
channels and ebb shoals found for the evaluated grid
lated slopes to changes in interval, a 5-m square grid
was judged to be optimal for this application. In
intervals. Calculated slope magnitudes decrease uni-
addition to minimizing the amount of data lost to
formly with increased filtering from the largest inter-
filtering, the 5-m interval resolved all significant
val of 100 m to the smallest of 5 m.
features of the inlet identified by visual inspection
Based upon the mean sampling interval of all
of the original data without exaggerating isolated,
SHOALS data sets (4.6 m), more dense coverage
smaller scale variations in the bathymetry.
through the inlet and around the ebb-tidal shoal, visual
Table 4
Slope dependence on grid spacing
3. Results
Dx, m
Inlet channel slope, j
Ebb-shoal slope, j
3.1. Limiting slopes
5
8 10
45
25
68
2.5 3
50
57
2.25 3
Steepest slopes were found at the shoreline, along
100
35
1.75 2.5
the lateral sides of the inlet channels, sides of scour


 Previous Page
