S.A. Hughes / Coastal Engineering 51 (2004) 10671084
1077
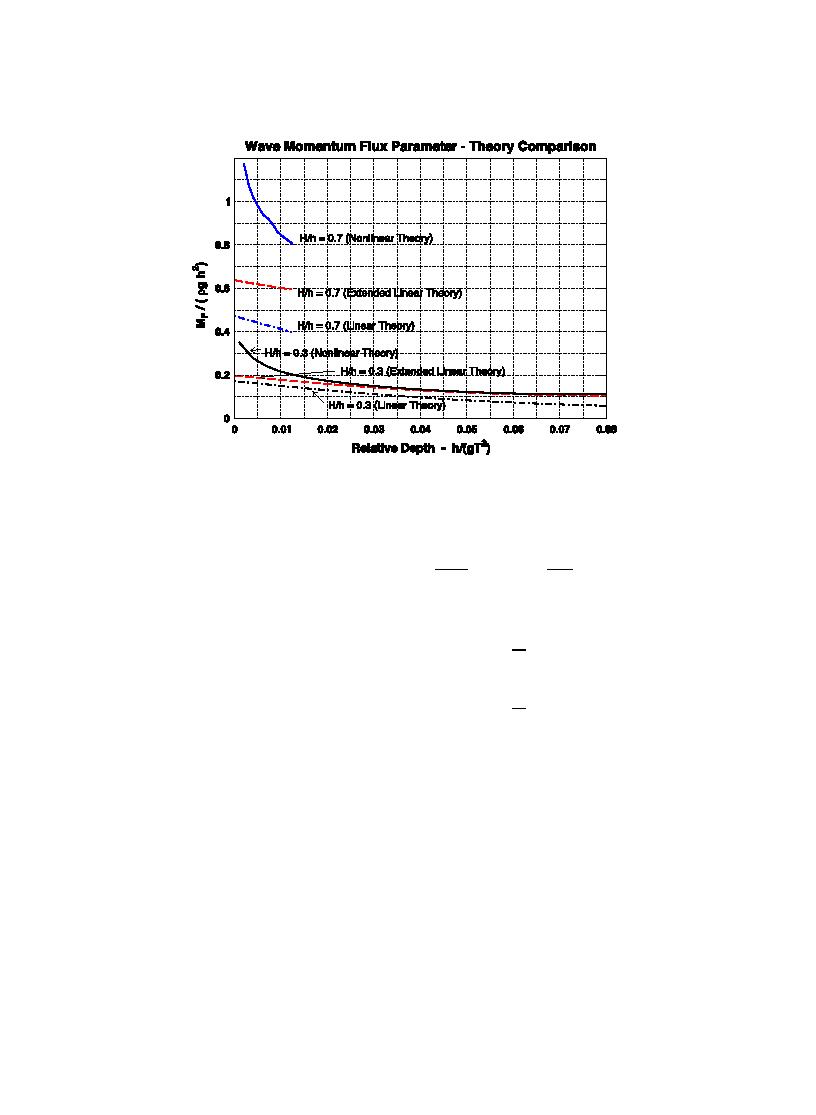
Fig. 5. Comparison of linear, extended linear, and finite-amplitude wave momentum flux parameters.
amplitude curves. Thus, the simpler, analytical linear
curves. The resulting, purely empirical equation
theories could be used without significant loss of
representing the curves shown on Fig. 4 is given as
A1
validity, provided the same linear theory was used for
MF
h
all cases. However, one of the stated criteria for this
A0
20
qgh2 max
gT 2
new parameter is that it must be useful for regular
waves, irregular waves, and nonperiodic waves. By
where
using the best estimate of (MF)max for each category
2:0256
of wave, it may be possible in the future to relate
H
A0 0:6392
21
design guidance established for one type of wave to
h
similar circumstances involving other wave types. For
0:391
example, if rubble-mound armor stability can be
H
A1 0:1804
22
related to (MF)max for regular waves, then it may be
h
possible to extend the stability prediction to structures
exposed to transient ship-generated waves or solitary
Although the empirical coefficients and exponents in
waves simply by estimating the maximum depth-
Eqs. (21) and (22) are expressed to four decimal places,
integrated wave momentum flux for the other type of
corresponding accuracy is not implied. Rounding to
wave. For this reason, it is suggested that estimates of
two decimal places should be reasonably adequate for
(MF)max for regular periodic waves be made using the
practical application of these empirical equations.
Fourier approximation method.
Goodness-of-fit of Eq. (20) compared to the
An empirical equation for estimating the wave
computed values given on Fig. 4 is shown on Fig.
momentum flux parameter for finite amplitude steady
6. For smaller values of nondimensional (MF)max,
waves was established using the calculated curves of
there is reasonable correspondence except for the
constant H/h shown in Fig. 4. A nonlinear best-fit of a
left-most points of each curve (shown below the line
two-parameter power curve was performed for each
of equivalence). This divergence was caused by
calculated H/h curve. Next, the resulting power curve
the power curve tending toward positive infinity as
h/gT2Y0. However, greater deviation begins to occur
coefficients and exponents were plotted as a function
of H/h, and fortunately, both the coefficients and
for dimensionless (MF)maxN0.6. Nevertheless, the
exponents could be reasonably represented by power
only poorly fitted curve is for H/h=0.8 which is at


 Previous Page
