meet specific RTK-GPS
thresholds. After these
basic procedures were
completed, the data was
filtered in a customized
MATLAB routine called
the
Beach-profile
Analysis MATLAB-tool
or BAM (Park 2002).
BAM was specifically
designed for QA/QC, and
to process and analyze
large amounts of marine
and
terrestrial
data
collected
through
methods similar to those
described in this paper.
The BAM module applied
for this project was
designed to analyze and
delete redundant points
and sonar spikes, correct
any draft errors, and
merge the data into one
topo/bathy file. Once the
files were "clean" and
merged, the data was
ready to process into 3D
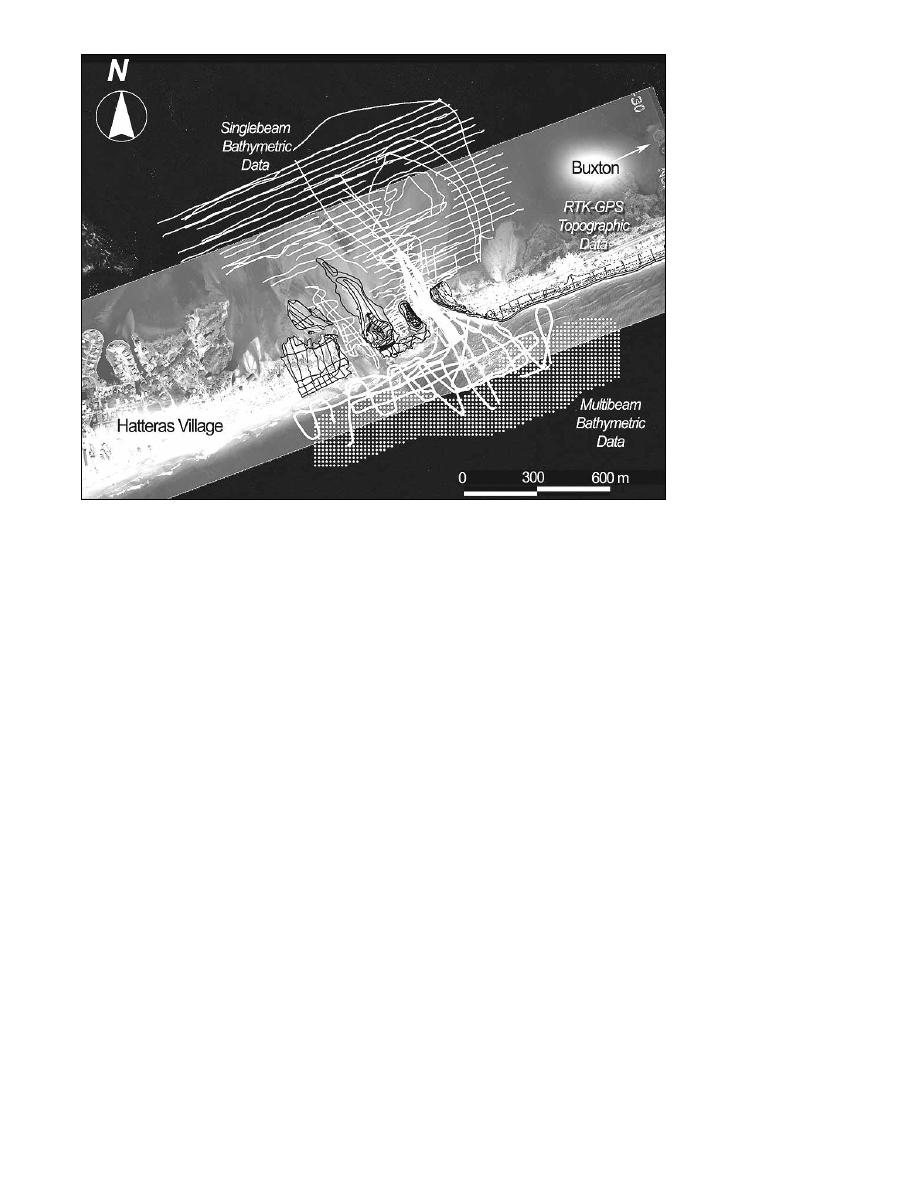
Figure 6. Survey coverage map.
elevation models.
Processing massive and sometimes oversampled datasets into
tidal currents in the main breach channel, submerged and
accurate DEMs, representing shoreline topography and
exposed roadbed and wood pilings, cut power and cable lines
nearshore bathymetry with strong anisotropy, provides a unique
freely drifting in the main channel, and a large amount of floating
challenge (Mitasova et al. 2003). An adequate gridding method
and partially submerged debris.
is important in order to produce a temporal series of coastal
These natural and storm-induced obstacles at the survey
elevation and bathymetric surfaces, with a minimum of distortion
location required a survey strategy that was governed by stages
in the output geometry. While a TIN (Triangular Irregular
of the tide. Bathymetric surveys within the main breach were
Network) is most commonly used in elevation modeling, it
conducted around and during the time of slack high tide due to
becomes problematic when a series of surfaces, each based on a
the tremendous tidal and wind-driven currents in the channel
different set of measured points, needs to be compared (Mitasova
(Figure 5) and the presence of submerged roadbed and pilings.
et al. 2003). The comparison is greatly simplified if all data are
Hydrographic surveys within the backbarrier, along the flood
gridded at the same resolution and map algebra is applied for
tidal delta and in the surf zone were accomplished during a
computing differences between elevation surfaces and other
higher tide stage to avoid breaking waves in the nearshore and
measures. The selection of a gridding method strongly depends
exposed tidal flats in the backbarrier. Although the Surfzone
on the spatial distribution of input data, resolution of the output
Explorer is able to map in less than 30 cm of water, the
grid, and the anticipated properties of the modeled terrain.
shallowest regions of the flood delta and backbarrier required
additional RTK elevation surveys. Complete survey coverage
To preserve most of the detail captured from these high-
was obtained in these regions with the backpack system during
density surveys and minimize artifacts commonly created by
peak low tides. All topographic data collection occurred around
standard interpolation algorithms such as a TIN, a Universal
the times of low to peak low tide in order to capture the
Krigging method (Bernstein et al. 2003) was applied. The
maximum amount of subaerial exposure, ensure complete
parameters were specifically tuned to the spatial pattern and
overlap with bathymetric surveys and to navigate the dangerous
along-track density of the survey data and modeled topo/bathy
debris field in the center of the breach. The flexible topo/bathy
output (Bernstein et al. 2003; Mitasova et al. 2004). One of the
surveying strategy proved highly efficient, greater than 80 line
challenges in modeling elevation data derived from RTK-GPS
kilometers of singlebeam and multibeam sonar data, and
and singlebeam sonar is that the density of points along the
approximately 65 line kilometers of topographic data were
survey line is high (1-2 m apart) while the distance between
collected in a total of about 5 days.
survey lines is typically 10-150 m apart. By incorporating an
anisotropy factor and other tunable parameters into the gridding
3D TOPO/BATHY PROCESSING & ANALYSIS
procedure, the accuracy and repeatability of the resulting DEM is
substantially improved (Bernstein et al. 2003; Mitasova et al.
Quality assurance and quality control (QA/QC) of the
2004). Figure 7 illustrates a detailed 3D elevation model of the
approximately 1.5 million data points (Figure 6) began with a
breach calculated from the high-resolution topographic and
first order procedure to ensure data quality and general
bathymetric data merged at the land/water interface. Wamsley
consistency. This included correcting sonar data for motion and
and Hathaway (2004) give a complete discussion of the breach
tides and inspecting topographic information to ensure all data
6
Shore & Beach Vol. 72, No. 2, Spring 2004, pp. 3 - 7


 Previous Page
