Home
Download PDF
Order CD-ROM
Order in Print
Home
>
Costal Inlets Research Program
>
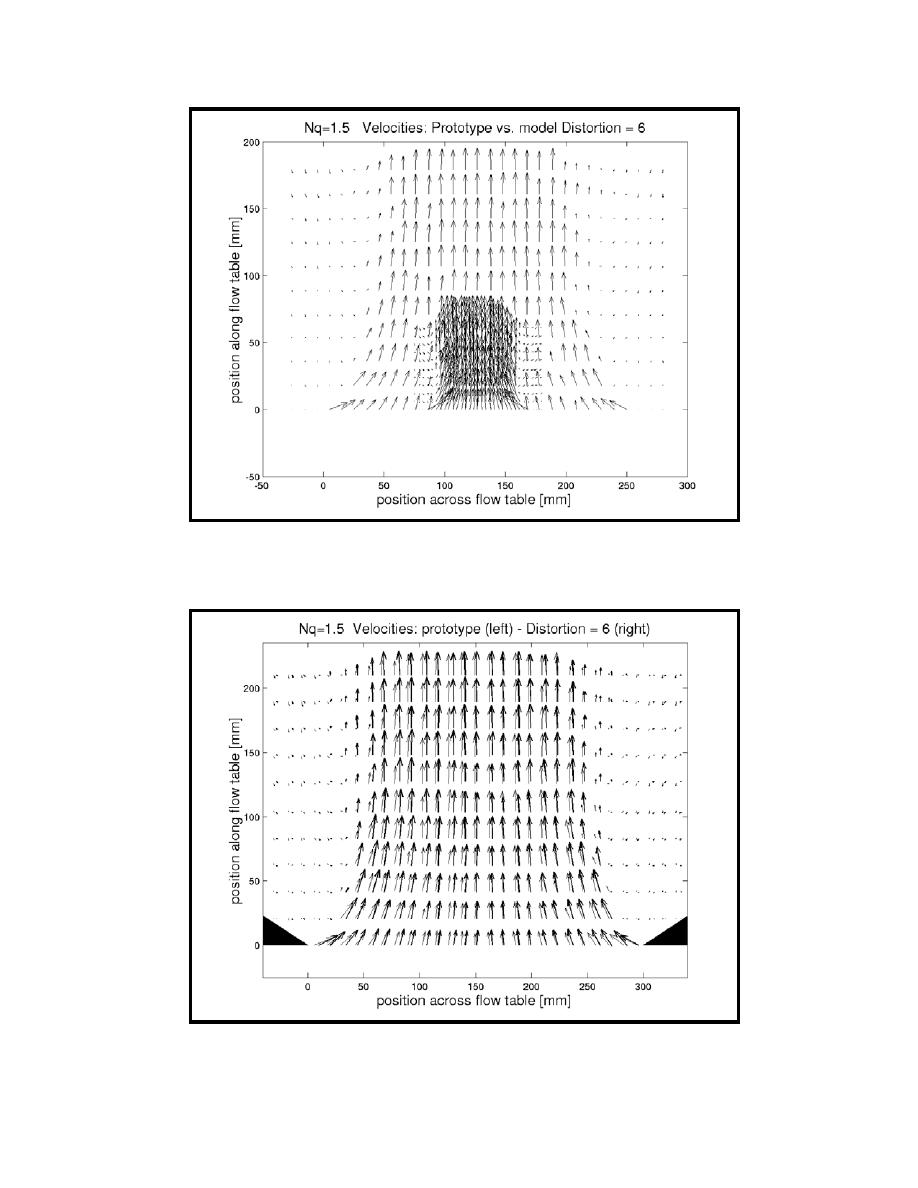
> Figure 25. Comparison between prototype and distortion = 6, NQ = 1.5 (Case 1)
Figure 23. Velocity field NQ = 1.5, distortion = 4 (Case 1)
Figure 27. Crossflow velocity ratios, distortion = 2,4,6 over prototype (NQ = 1.5, Case 1)
TR-03-6
Page Navigation
42
43
44
45
46
47
48
49
50
51
52
Figure
25.
Comparison
between
prototype
and
distortion
= 6,
N
Q
= 1
.
5
(Case
1)
Figure
26.
Velocity
field
N
Q
= 1
.
5,
prototype
vs.
distortion
= 6
(Case
1)
47
Chapter
5
Turbulence
Scale
Effects
Experiments


 Previous Page
