Tidal Circulation Modeling
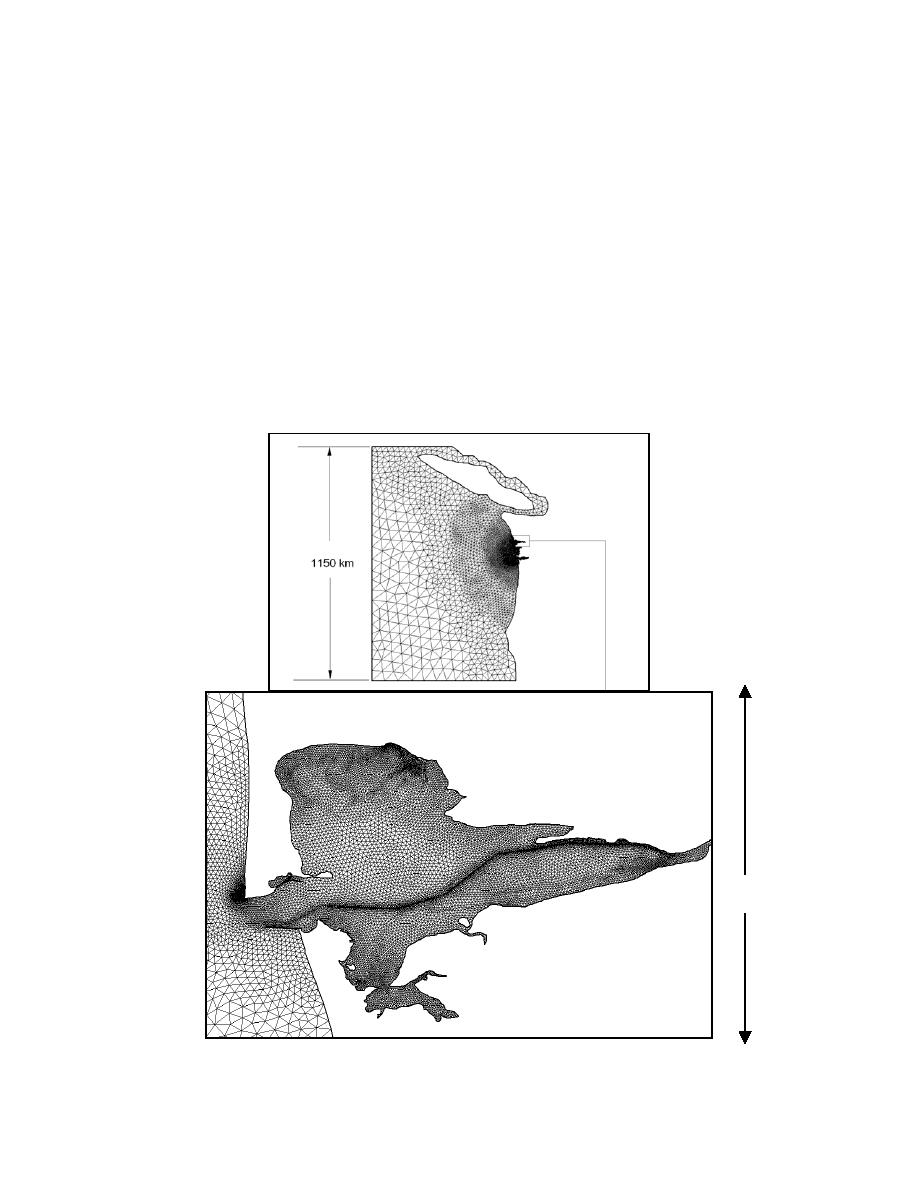
A finite-element grid was developed for the ADCIRC model to simulate water surface
elevation and circulation as a function of tidal and wind forcing over the entire Grays
Harbor region (Fig. 3). The ADCIRC grid contains 31,838 elements and 16,916 nodes,
with the finest resolution along the federal navigation channel. The shoreline north of
Grays Harbor (known as Ocean Shores) also shows fine grid resolution and is part of
another coastal study. The ADCIRC model was driven with the Le Provost et al (1994)
tidal constituent database for the field-data collection time period (September to November
1999). Figure 4 is a time-series of water surface elevation from the field data collection
time period and computations at South Bay and Aberdeen (see Fig. 1 for locations).
Model results correspond to the field data both in amplitude and phase at both the southern
and eastern ends of the bay. Figure 5 is a time-series of current speed from the field data
collection time period and computations at Inlet Stations 2 and 4. Computations
correspond to the field data in amplitude with slight phase differences, attributable to
bathymetric inaccuracies. Ebb and flood current data and model results show the strongest
flood currents are on the north side of the inlet. Ebb currents are more uniformly
distributed (Fig. 6).
28 km
Fig 3. ADCIRC computation grid and details of Grays Harbor, Washington portion of the grid
Cialone & Kraus
4


 Previous Page
