

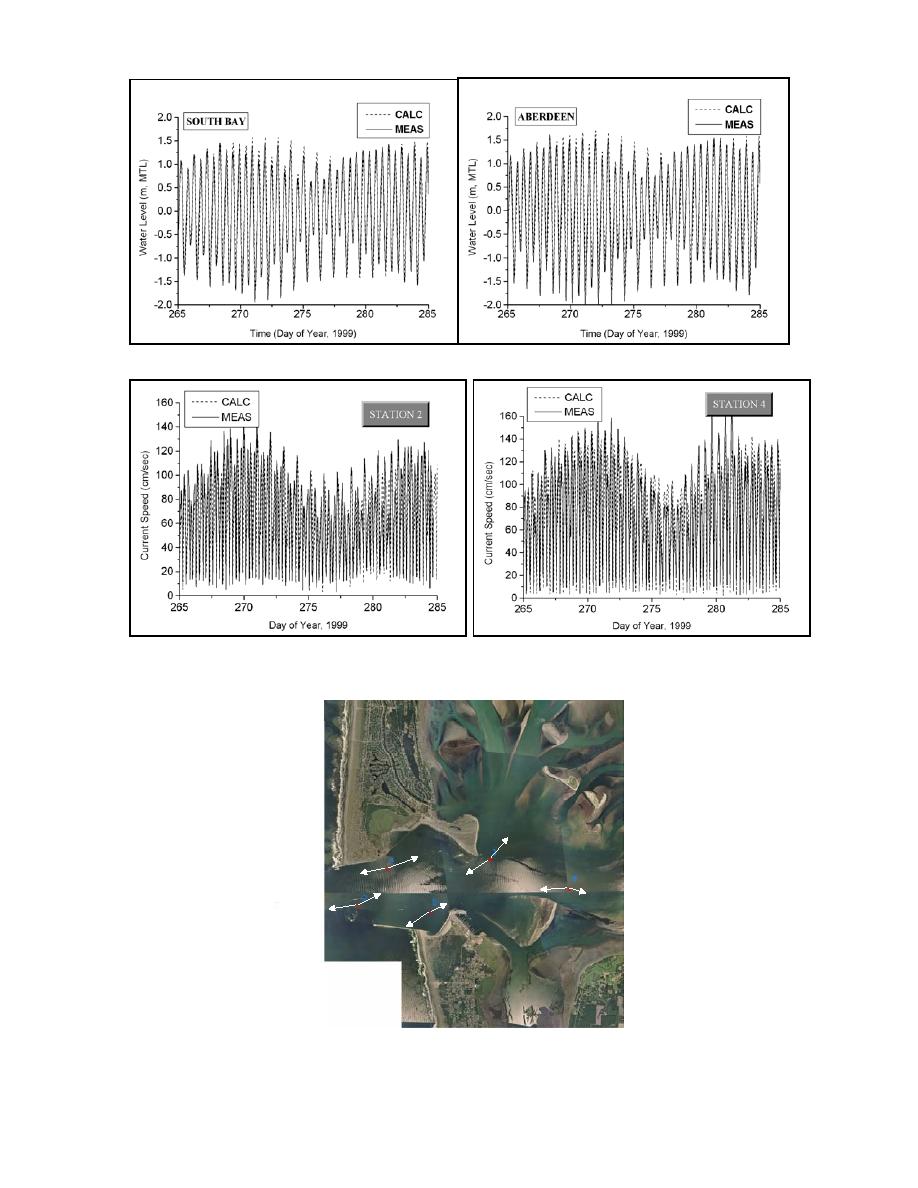
Fig 4. Comparison of measured water levels and ADCIRC model results at bay stations 2 and 4
Fig 5. Comparison of measured currents and ADCIRC model results at inlet stations 2 and 4
Flood strongest
Flood
103
on north side
120
97
95
92
93
66
66
102
99
Ebb is fairly
uniform
Fig 6. Average peak ebb and flood currents (cm/sec) for first month of field data collection
Cialone & Kraus
5

 Previous Page
