

Wave Propagation Modeling
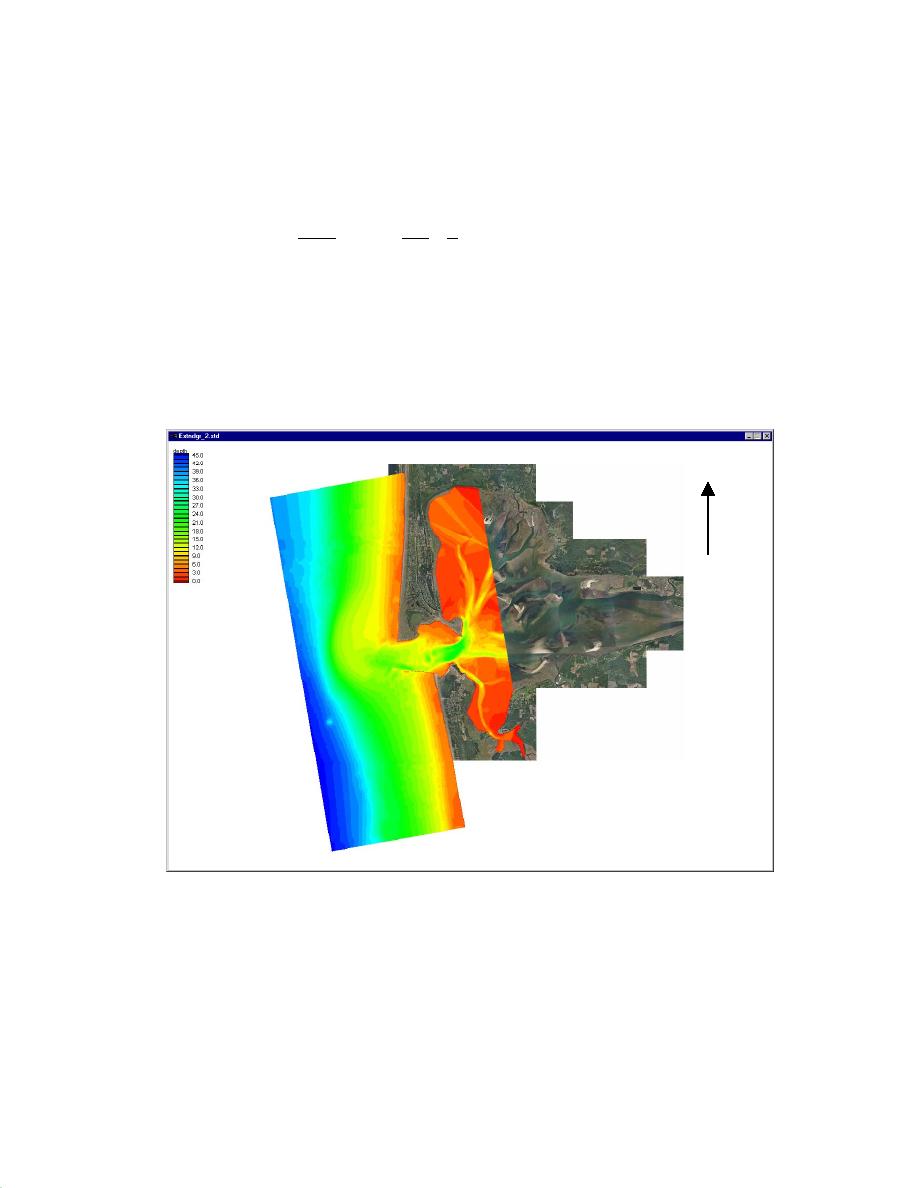
A computational grid for the region shown in Fig. 7 was developed for the spectral wave
model STWAVE, which computes nearshore wind-wave growth and propagation (Resio
1987, 1988a, 1988b; Davis 1992). (This application did not consider wind-wave growth
because the 9-km fetch had a limited effect on wave height (typically less than 15%).)
Bathymetric data were obtained from the U.S. Army Engineer District, Seattle 1999 annual
survey and from the GEOphysical DAta System GEODAS database of Hydrographic
Survey Data (National Geophysical Data Center of NOAA). The vertical datum was
adjusted from mean lower low water to mean tide level with the Westport (Fig. 1) tidal
benchmark adjustment of 1.5 m. Tidal elevation data were added to the mean tide level
bathymetry for each simulation where the influence of tide level was considered. The grid
orientation is 10 deg west of north to align the longshore axis with the offshore bathymetric
contours (Fig. 7). The STWAVE grid had 341 cells in the cross shore direction and 588
cells in the longshore direction with a cell size of 50 x 50 m.

 Previous Page
