2π/year. Then, if the initial position of the spit at t = 0 is located at x = 0, the
solution of Eq. 1 for the location of the tip of the spit, denoted as xS, is
F
I
Q′
G
J
1
H
K
sin(σt )
xS =
Qt +
(3)
2σ
WD
Eq. 3 shows that spit elongation is directly proportional to the longshore
sediment transport rate and to elapsed time, as modified by the fluctuating rate, and
inversely proportional to spit width and depth of active movement. It is feasible that
the spit could shorten during a transport reversal, depending on the magnitudes of
Q , Q′and σ.
,
The elongation rate of the time-dependent term in Eq. 3 depends inversely on the
angular frequency. This means that, for the same amplitude of transport Q′2 , a
/
higher-frequency motion will damp more quickly and be less-perceptible than a
5 m, and W = 100 m. In addition, suppose that two sinusoidal forcings occur with
respective angular frequencies of 2π/(1 year) and 2π/(1 month) and equal amplitude
Q′2 = 50,000 m3/year. Then, in one year, xS = 200 m, which is a plausible
/
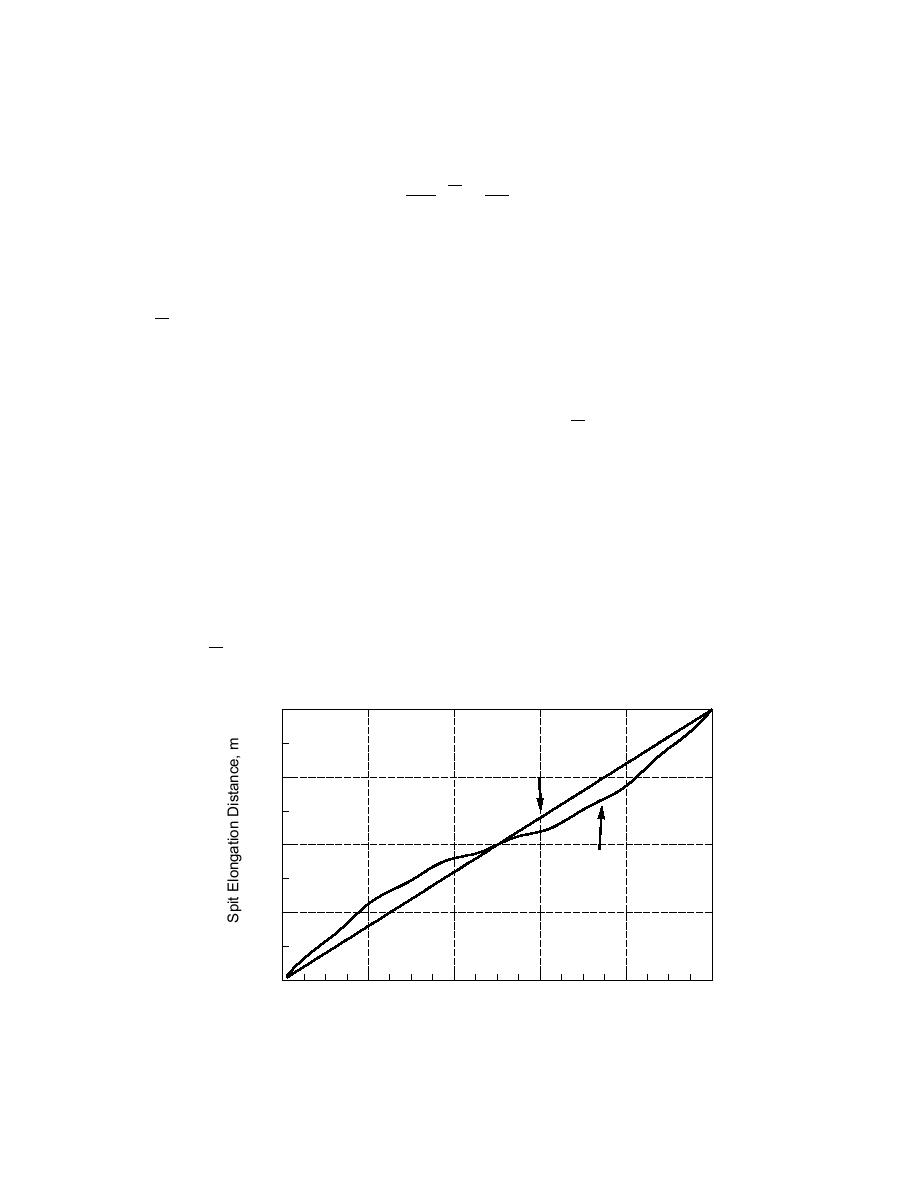
distance. Fig. 2 shows the linear growth of the spit as produced by the mean
transport rate and the growth as modified by the two terms. The response of the spit
to the monthly change in transport rate is barely perceptible despite having the same
amplitude as the annual fluctuation.
For reference in interpreting the mean longshore transport rate, it can be shown
that for N equi-spaced measurements of the rate, the net longshore transport rate
Qn = N Q . For the remainder of this section, we take Q′ 0.
=
200
Unrestricted Spit Growth
Constant Longshore
Transport Rate
150
100
Annual and monthly
variation about constant
transport rate
50
0
0.0
0.2
0.4
0.6
0.8
1.0
Elapsed Time, year
Fig. 2. Unrestricted spit elongation, constant and with time variation in transport.
Kraus
5


 Previous Page
