

plot (Figure 2-20) and the desired equation for fitting the data (Figure 2-21). The
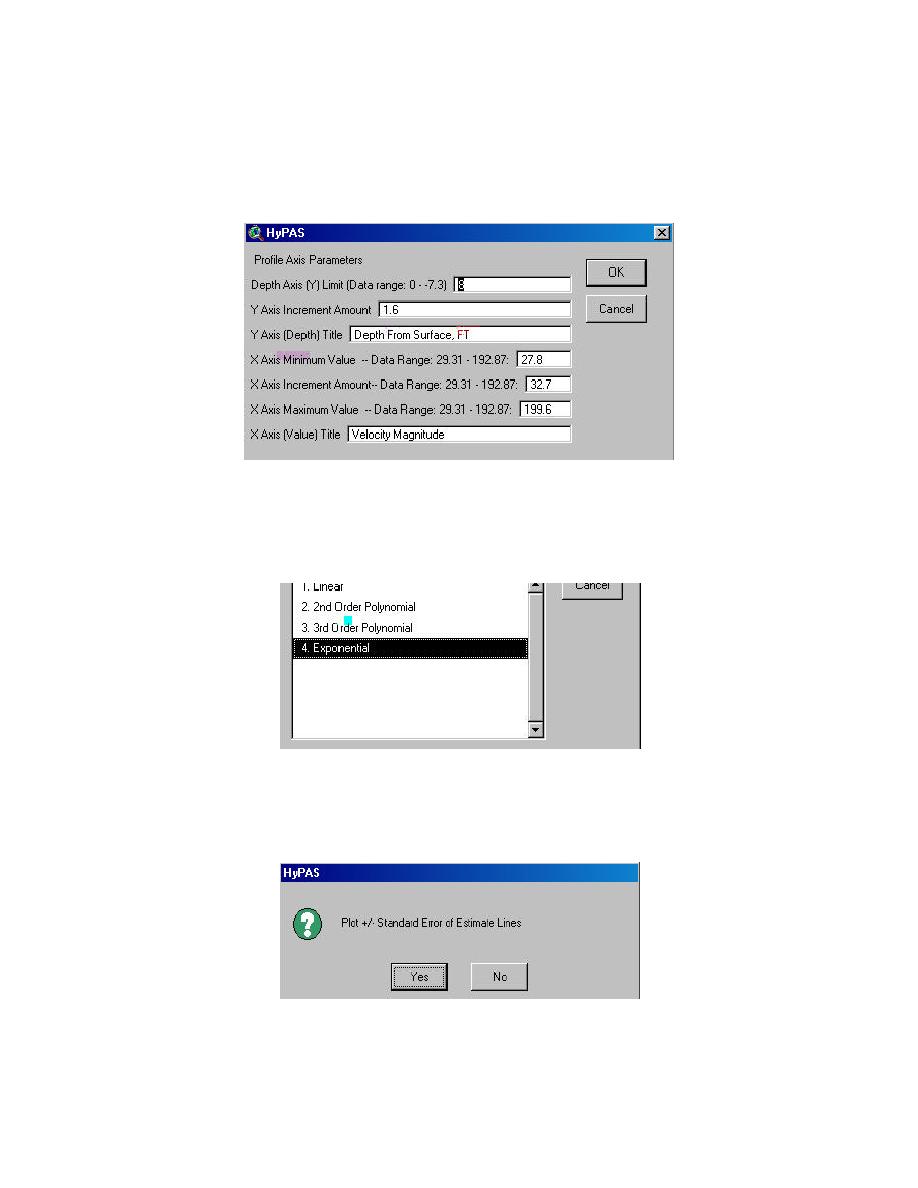
options in Figure 20 simply define the limits, increments, and titles of the x and y
axes on the plot. The default values will work for quick profiles. HyPAS will plot
the actual points and then fit an equation to the points. The fitted equation line/curve
is also plotted.
Figure 2-20. Profile plot axis parameters input box
Figure 2-21. Equation for data fit selection box
HyPAS will then prompt the user on whether to include Standard Error of
Estimates (SEE) along with the data (Figure 2-22). Figure 2-23 shows the box
HyPAS will produce to explain Standard of Error Estimates.
Figure 2-22. Plot SEE prompt
2-8
Chapter 2 Plan View Velocity Analysis

 Previous Page
