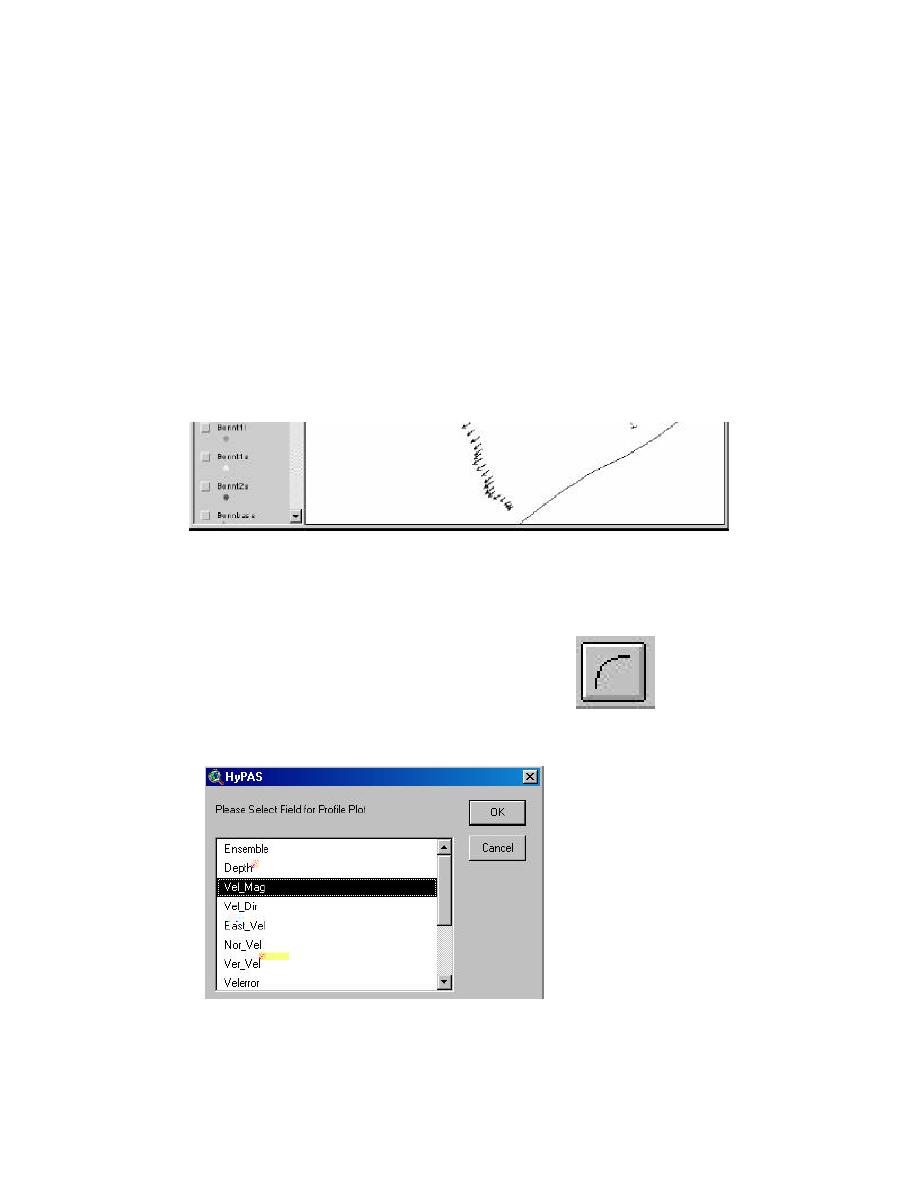
HyPAS creates a theme with vectors. These vectors are scaled using the total
velocity magnitude and displayed in the direction of flow (Figure 2-17).
Figure 2-17. Example of a vector magnitude and direction plot
Velocity Profiles
HyPAS will also allow the user to plot velocity profiles
of the ADCP data. Using ArcView, the desired point(s)
should be selected. Click the Plot Profile Curves button
(Figure 2-18) on the HyPAS menu to begin the process.
Figure 2-19 shows the available constituents . Sele ct the
Figure 2-18. Plot
desired constituent to profile and click OK.
profile curves button
Figure 2-19. Select field for profile plot box
The user will then be prompted for axis parameters to be applied to the profile
2-7
Chapter 2 Plan View Velocity Analysis


 Previous Page
