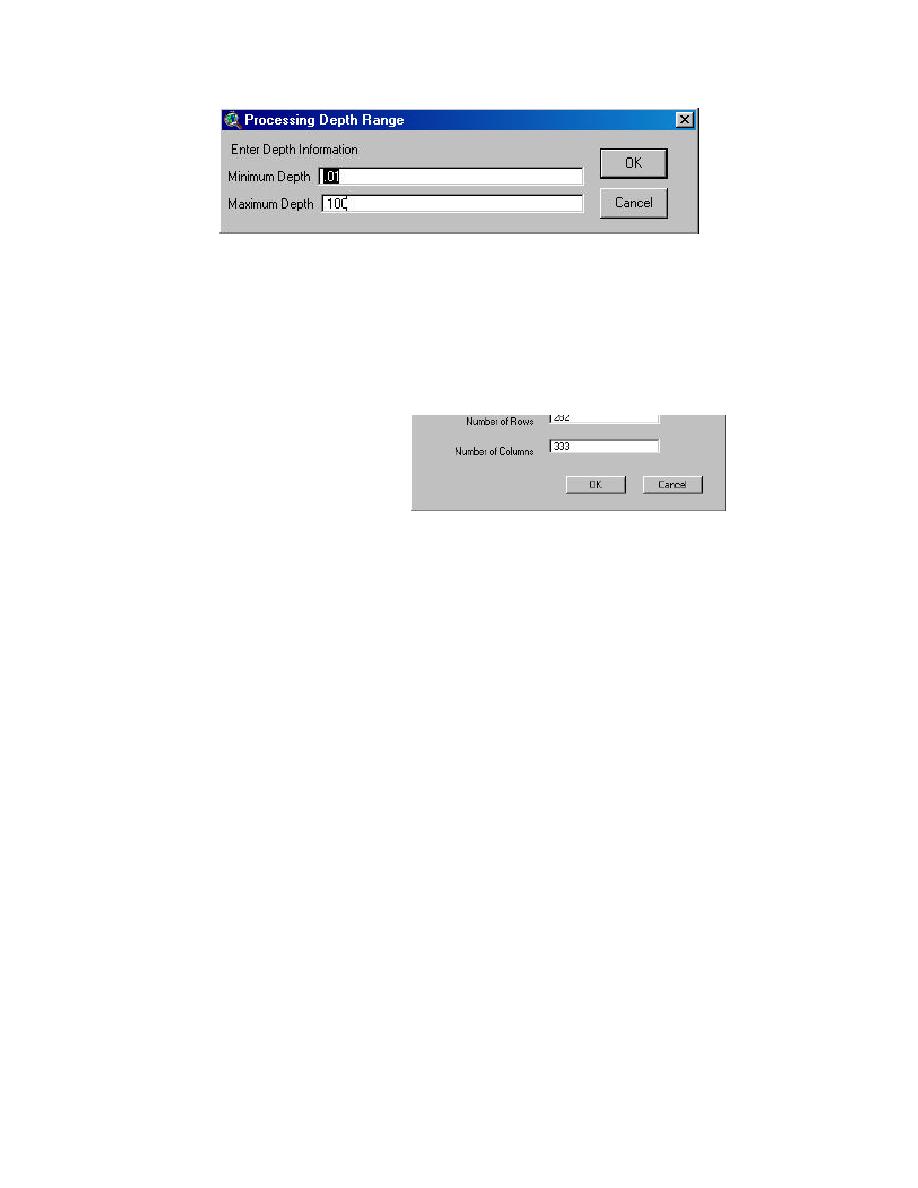
Figure 2-7. Processing depth range prompt
The output grid extent
parameter defines the external
limits of the resulting
interpolation. Because HyPAS
zooms to the extent of the
selected points, the default value
Same as Display is the best
choice. The other three
parameters--Output Grid Cell
Size, Number of Rows, and
Number of Columns--define the
raster intensity of the output grid. Figure 2-8. Prompt for specifications for
These parameters are connected; the output grid
therefore, changing any one
changes all. The user may want to adjust this. Increasing the number of cells
smooths the output. The trade-off is it decreases the speed of the interpolation
process. The default value will be adequate for most applications, although rounding
the cell size will increase clarity.
HyPAS then prompts for an Output Grid name (Figure 2-9). This is the physical
name of the resulting file to be stored on disk. HyPAS then prompts for the
constituent to contour (Figure 2-10). Choose the constituent and click OK.
HyPAS creates a theme with the resulting interpolation. Additionally, the theme will
be displayed with a legend.
HyPAS then prompts for a contour interval and base contour (Figure 2-11).
Enter the desired contour interval and base contour. The user can see the extent of
the data by the legend generated with the grid theme. See Chapter 7 for plotting.
2-4
Chapter 2 Plan View Velocity Analysis


 Previous Page
