

A. Bayram et al. / Coastal Engineering 44 (2001) 7999
91
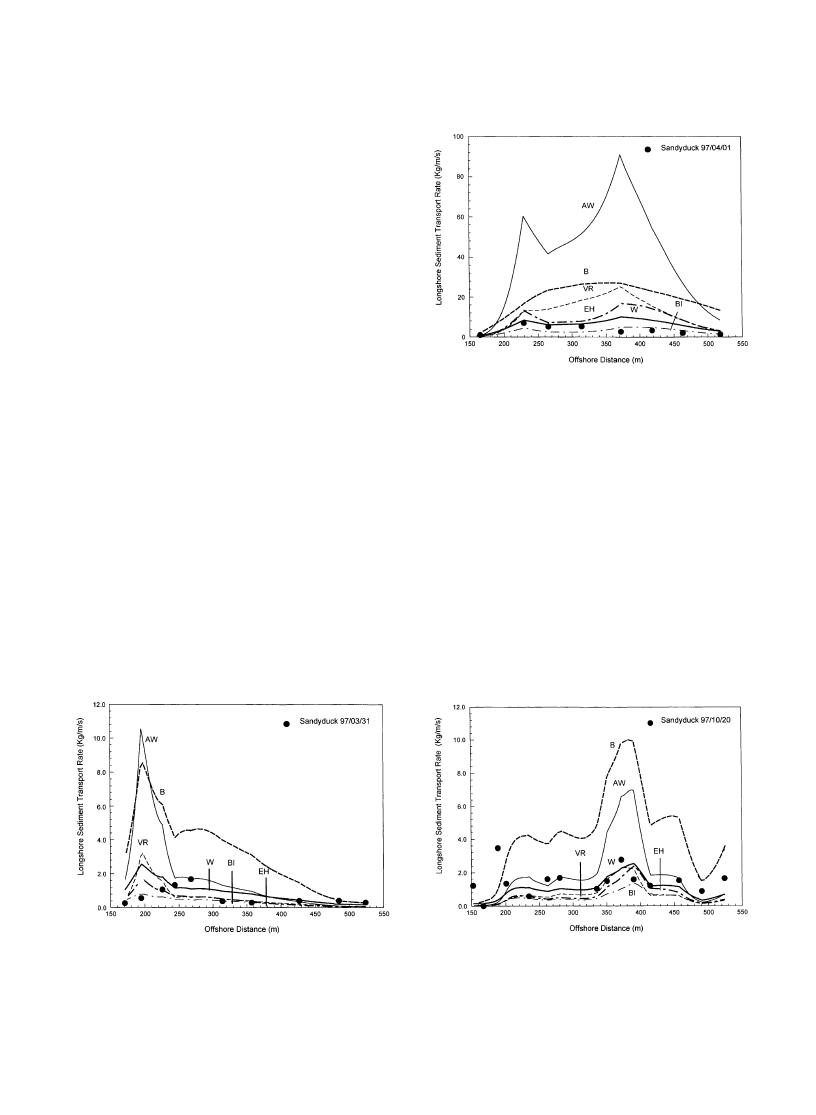
in Fig. 10. For this run, the predicted peak transport
rates are markedly shifted shoreward relative to the
measured peak. Thus, all formulas produce unsatis-
factory results, although the BI, EH, VR, and W
formulas yield values that are more in agreement with
the data than the AW and B formulas. In Fig. 11
comparisons are made between predictions and meas-
urements for the run on April 1, 1997. As for Run 97/
03/31, the BI, EH and W formulas capture the main
features of the measured transport rate distribution.
Consequently, these formulas give better predictions
under sheet flow conditions than if low-energy swell
waves prevail, which was the case for DUCK85 and
SUPERDUCK. The AW and B formulas have a
Fig. 11. Comparison between calculated and measured cross-shore
tendency to overpredict under conditions giving large
distribution of longshore sediment transport rate for Run 97/04/01
measured transport rates, especially the AW formula.
from the SANDYDUCK experiment.
This is partly because under high waves in the surf
zone the transport is dominated by suspended load. As
shown by Larson et al. (in preparation), the formulas
is difficult to explain in terms of the measured forcing.
typically overestimate the time-averaged sediment
Calculations with the AW, BI, EH, VR, and W for-
concentration, implying that the total transport rate
mulas yield acceptable agreement with the measured
becomes too large.
distribution in most of the surf zone, but near the
Fig. 12 shows predicted and measured longshore
shoreline the measured peak is not predicted. The
transport rates for a storm on October 20, 1997. The
measured wave heights and currents at the points
measured transport rate distribution across shore is
closest to the shoreline do not indicate a potential
bimodal with one peak just shoreward of the break
for large transport here. The AW and B formulas
point and the other peak near the shoreline. However,
overpredict the transport rate in the outer part of the
there is a large variability in the measured rate, both at
surf zone, but are doing better in the inner part, as well
the scale of the surf zone and in between points, which
as outside the break point.
Fig. 12. Comparison between calculated and measured cross-shore
Fig. 10. Comparison between calculated and measured cross-shore
distribution of longshore sediment transport rate for Run 97/10/20
distribution of longshore sediment transport rate for Run 97/03/31
from the SANDYDUCK experiment.
from the SANDYDUCK experiment.

 Previous Page
