

92
A. Bayram et al. / Coastal Engineering 44 (2001) 7999
Fig. 13 shows calculated and measured transport
rate distributions for the run on February 4, 1998,
which is representative for large transport on a barred
profile during a storm. The peak in the transport rate
was observed some distance shoreward of the bar
crest, whereas the formulas predicted the peak to
occur more seaward (i.e., close to the bar crest). In
this respect, the BI, EH, and W formulas yield
locations of the peak transport that are more seaward
than predicted by AW, B, and VR. In contrast to Run
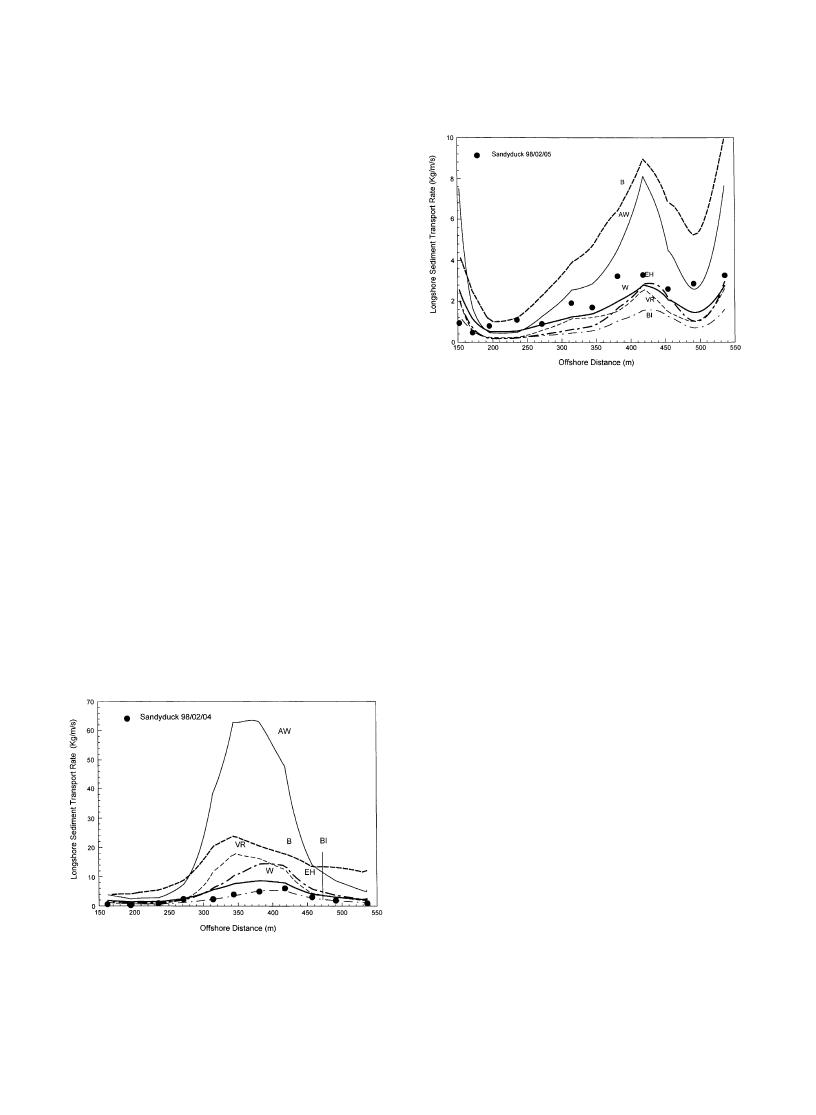
98/02/04, Fig. 14 shows a comparison for Run 98/02/
05 representative of the transport during a moderate
storm. Most of the formulas underpredict the transport
rate, however, the AW and B formulas are yielding
Fig. 14. Comparison between calculated and measured cross-shore
satisfactory agreement. The general features of the
distribution of longshore sediment transport rate for Run 98/02/05
cross-shore distribution are well reproduced by all
from the SANDYDUCK experiment.
formulas, indicating that tuning of the coefficients in
the formulas would considerably improve the predic-
tions.
except B displayed satisfactory agreement with the
Comparisons between the SANDYDUCK meas-
measured rates.
urements and the formulas allowed for an evaluation
of their predictive capability during storm conditions.
Overall, the AW and B formulas predicted higher
transport rates than the other formulas as well as the
5. Discussion of results
measurements. Also, the VR and W formulas yielded
Comparisons between field measurements and cal-
slightly better predictions than the BI and EH for-
culations indicated that several of the formulas yield
mulas. The formulas often failed to accurately predict
predictions that might be considered acceptable in
the location of the peak in the transport rate in the surf
many coastal engineering applications. However, to
zone. However, seaward of this peak, all formulas
objectively quantify the predictive capability of the
formulas, an overall comparison based on individual
point measurements was carried out for each formula.
Fig. 15 summarizes this comparison for the six
selected formulas and all measurements from the three
data sets. In the figure, the circles denote data points
from the DUCK85 and SUPERDUCK experiments,
representative of transport under low-energy condi-
tions, and the squares denote points from the SAN-
DYDUCK experiment, indicative of the transport
during storm conditions. Viewing Fig. 15, the BI
and VR formulas show best agreement regarding the
DUCK85 and SUPERDUCK data, displaying least
scatter around the line of perfect agreement (i.e., the
ratio between predicted and measured transports, qp/
qm, respectively, is one). Most of the computed values
are within a factor 5 of the measured values (see
Fig. 13. Comparison between calculated and measured cross-shore
dashed lines in Fig. 15) for these two formulas. The B
distribution of longshore sediment transport rate for Run 98/02/04
and W formulas have a tendency to overpredict the
from the SANDYDUCK experiment.

 Previous Page
