A. Bayram et al. / Coastal Engineering 44 (2001) 7999
93
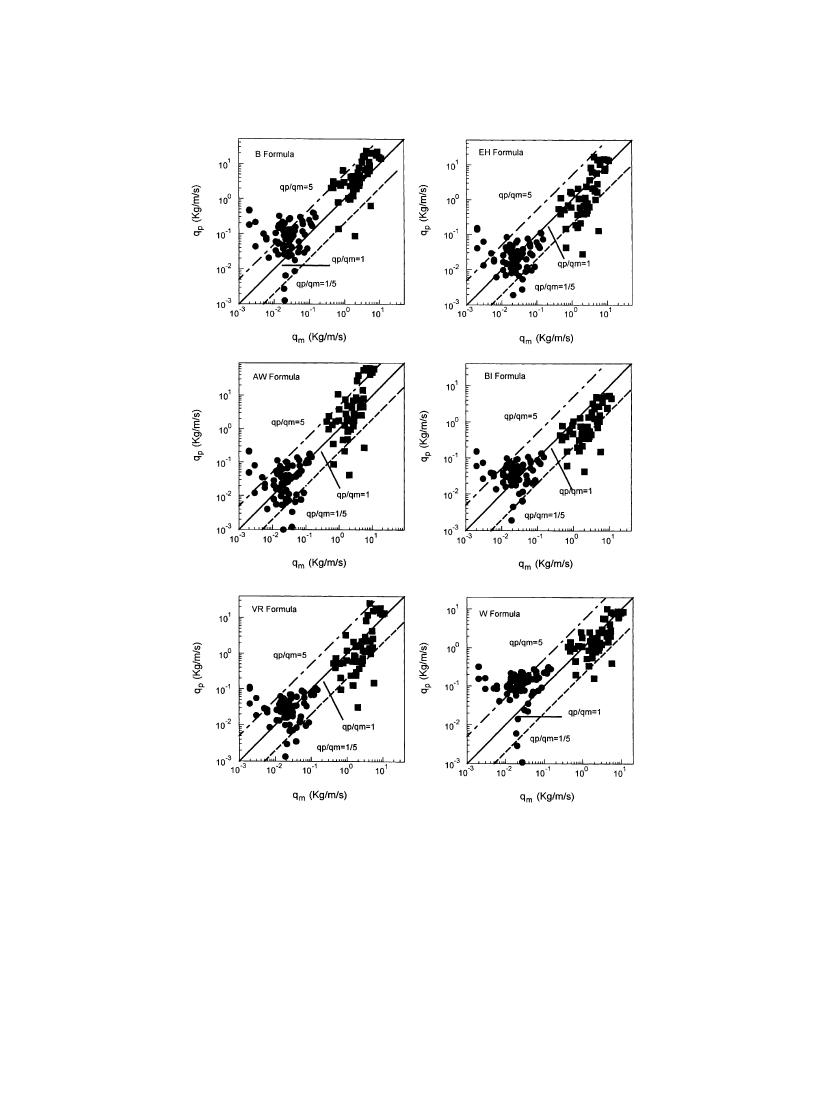
Fig. 15. Comparison between calculated and measured cross-shore distribution of longshore sediment transport for all three data sets
employed.
measured transport rates, whereas the AW and EH
too small. The VR and W formulas yield the least
formulas show considerably more scatter around the
scatter around the line of perfect agreement.
line qp/qm = 1.0. Concerning the SANDYDUCK data,
Quantitative and qualitative comparisons were
computed values with the AW and B formulas are
made between measurements and predictions regard-
typically too large and with the BI and EH formulas
ing the scatter, trend, and clustering of the calculated


 Previous Page
