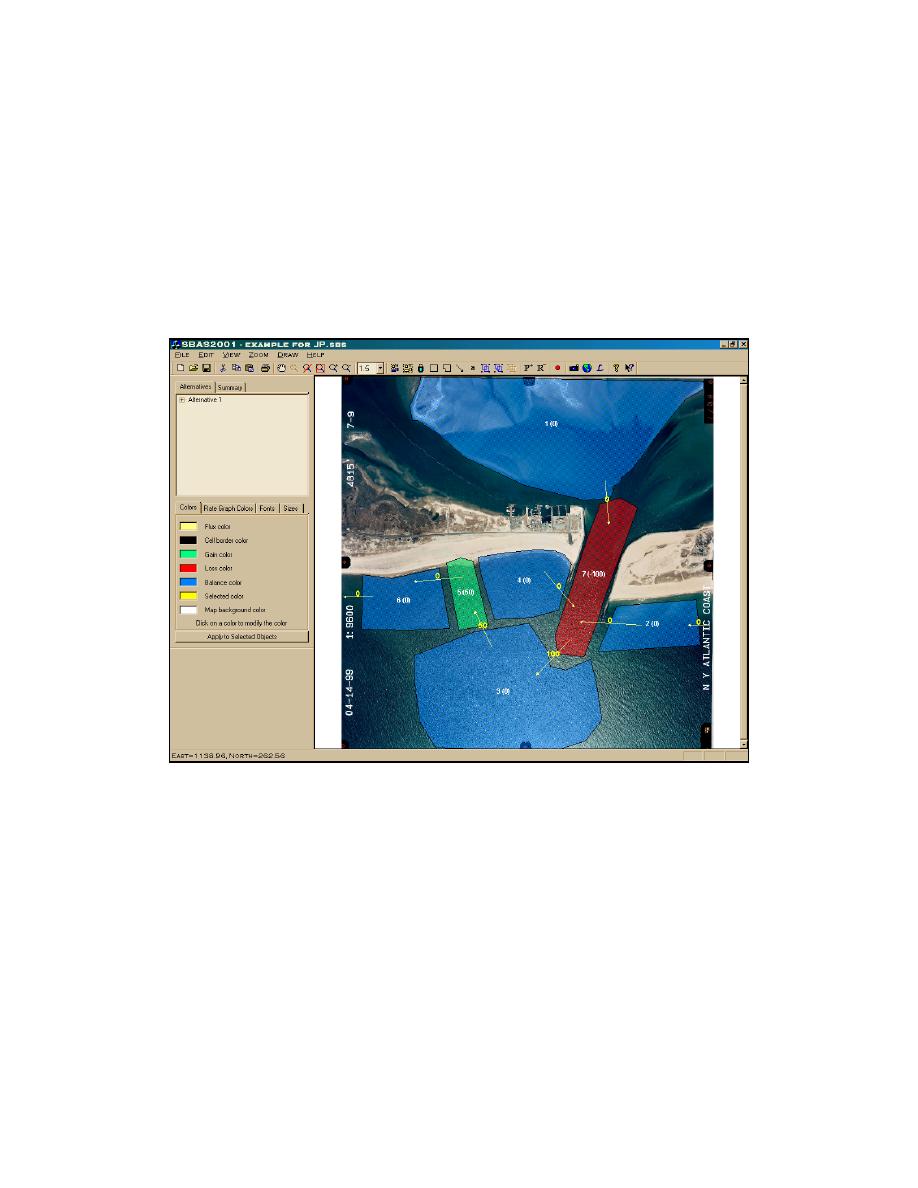
SBAS is operated within a graphical user interface to solve the conservation of volume (or
volume rate of change) equation for each sediment budget cell and any connecting cells through
sediment paths. The user drags-and-pulls the mouse to form squares or rectangles (sediment
budget cells) and arrows (sources and sinks into and out of each cell). Volume changes (or
volume change rates) are entered in a cell menu that is accessed by double clicking at a cell.
Engineering activities (placement and removal volumes or rates) can be entered with tools
appearing on the upper toolbar. Color-coding of the cells indicates whether the cell is balanced
or not. Sediment budgets such as calculated in SBAS typically range from a decade to more than
a century, and the spatial scale can vary from the vicinity of an inlet to hundreds of kilometers of
connected beaches interspersed with sediment sources and sinks.
Fig. 7. Sediment budget visualization in SBAS, Shinnecock Inlet, Long Island, New York
SBAS organizes the user's workspace and facilitates development and visualization of
alternative sediment budgets. Within the right-hand side of the screen, called the Topology
Window, SBAS formulates a sediment budget by allowing the user to create a series of cells and
arrows representing sources and sinks that characterize the budget. Geo-referenced and non-
referenced photographs may be incorporated as background to the budget.
The left-hand side of the screen organizes alternatives within a particular project.
Alternatives may represent various time periods, different boundary conditions for the same time
period, or modifications to assumptions within the budget reflecting a sensitivity analysis
(uncertainty analysis). Alternatives can be copied and modified. Once a sediment budget
alternative has been defined, and the user has created sediment budget cells with sources and
sinks, values can be assigned to the various components of the sediment-budget topology.
8


 Previous Page
