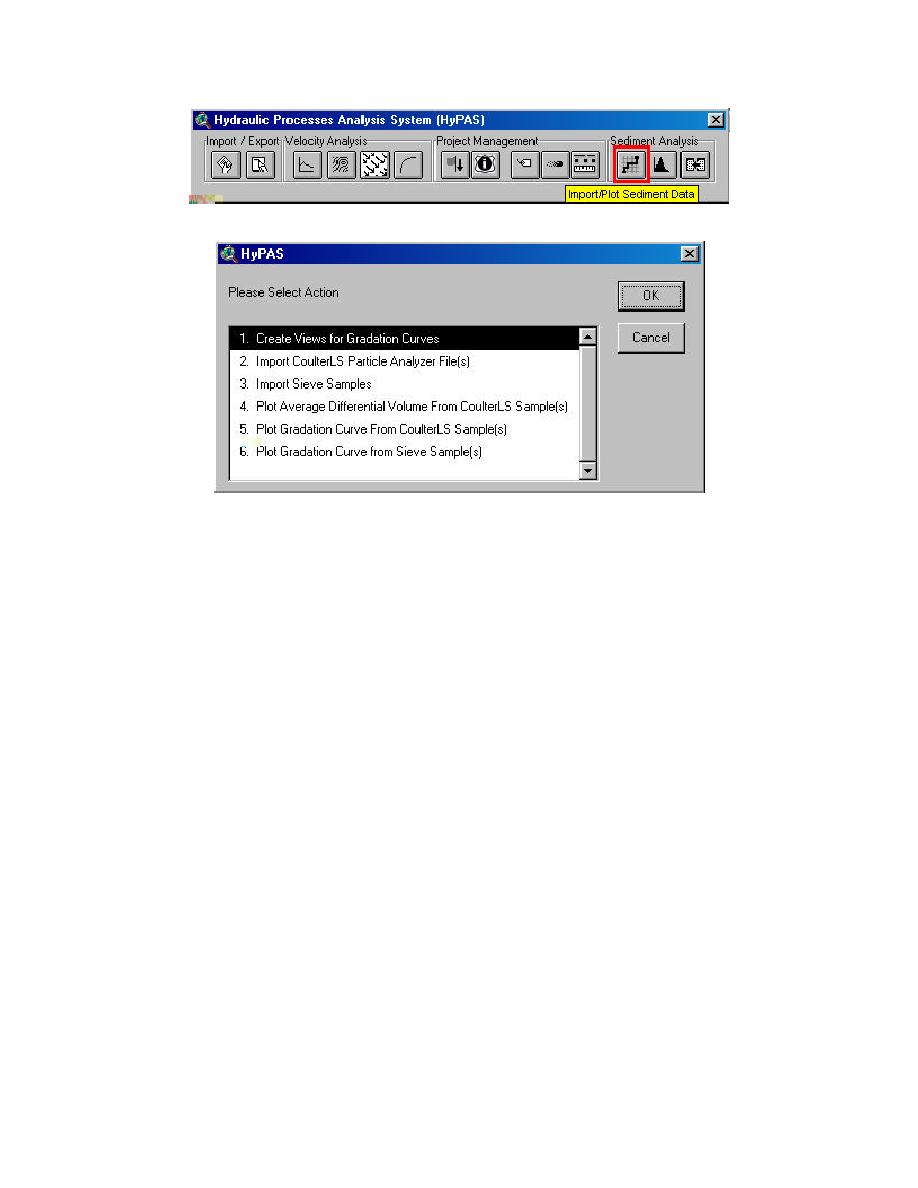
Figure 6-8. HyPAS menu with Import/Plot Sediment Data button highlighted
Figure 6-9. Sediment Data Options
The CoulterLS partictle analyzer file is a file exported from the CoulterLS
particle analyzer. This file format is not easily described; it is exported from the
CoulterLS particle analyzer. Please see Appendix A for an example of this type of
file.
The sieve samples file is an ascii file. Since the file format is not fully columnar,
it is not easily described. However it is a simple format that can be duplicated.
Please see Appendix A for an example of this type of file.
Plotting Gradation Curves from Other Sediment Data
To plot gradation curves from either sieve sediment data or CoulterLS sediment
data, have the sediment data theme ac tive and the sample points to be plotted
selected. Click on the Import/Plot Sediment Data on the HyPAS menu (Figure 6-8).
HyPAS Displays the Sediment Data Options menu (Figure 6-9). Choose either Plot
Sample(s) depending on which data you are plotting.
HyPAS prompts for the projection and datum of the samples. This is for text
on the plot, and the response does not change any view properties. HyPAS plots the
gradation curve (Figure 6-10). Any project information properly stored in the input
file, the X,Y coordinates and the projection and datum information input will also be
plotted on the gradation curve.
6-5
Chapter 6 Sediment Sample Analysis


 Previous Page
