

6
Sediment Sample Analysis
The "Sediment Sample Analysis" section of this report demonstrates how to
populate a sediment sample theme. Once the theme is populated, sample points can
be chosen for further analysis. Currently, there are two toolboxes for analyzing
sediment data, PHI Sediment Samples and Other Sediment Samples. The toolboxes
were funded under separate applications and will be combined in a future release.
There are many different types of analyses within the Sediment sample toolboxes.
Size distribution plots for single or multiple samples can be extracted. Gradation
curves can be plotted. As with the other spatial tools, different types of data can be
displayed concurrently, giving the user further insight into the current problem. For
example, bathymetry or velocity data can be displayed in the background while
selecting sample locations, giving the user the ability to make a selection based on
physical parameters rather than conjecture.
Importing PHI Sediment Data
To import Sediment sample data, click on the Import Data for HyPAS button
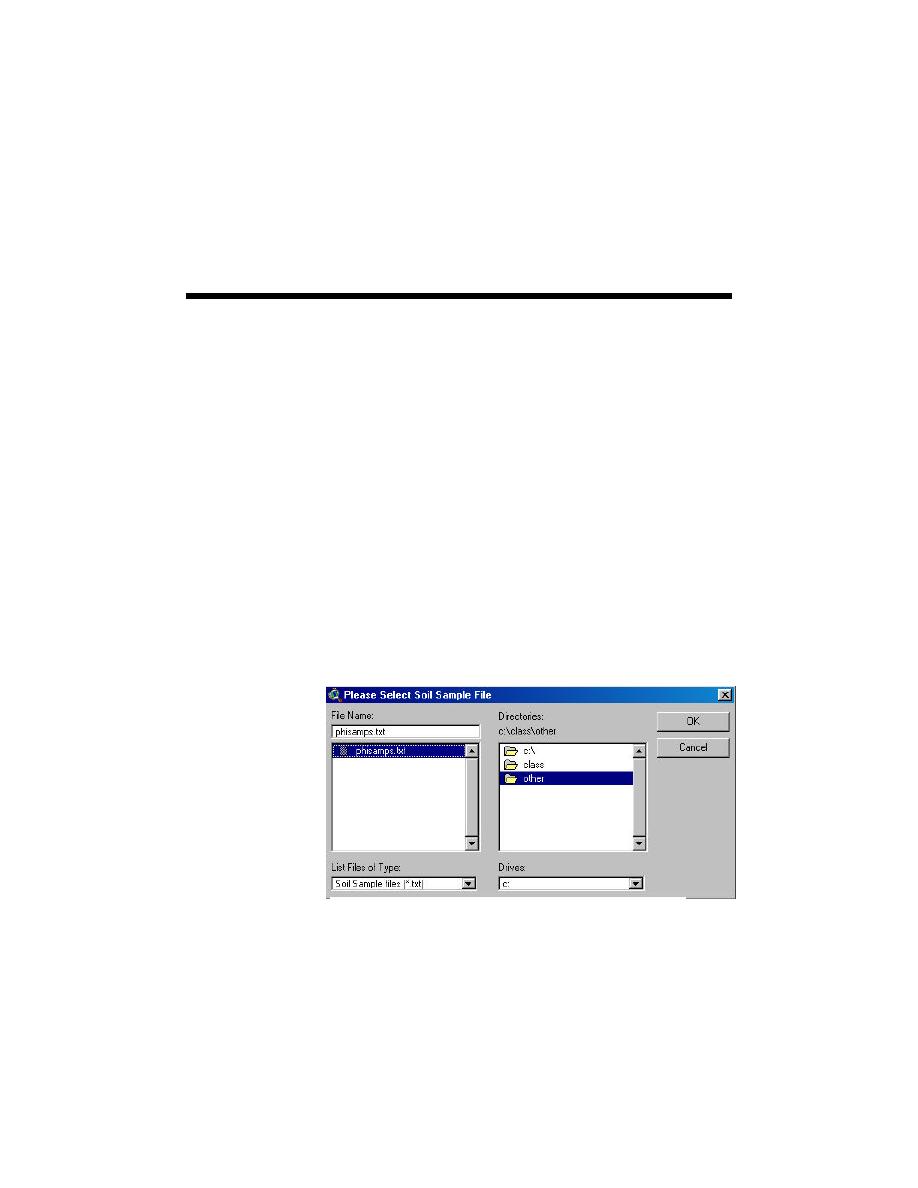
(Figure 2-1) and choose the Sediment Samples option (Figure 2-2). Next, select the
PHI sediment sample file in the Select Sediment Sample File menu, which appears
(Figure 6-1).
HyPAS imports the
data, creates a
Sediment samples'
theme for analysis,
creates a
composite table
with a composite
sample of all
samples, and
creates a
composite analysis
Figure 6-1. Menu to select Sediment sample
table for calculating
the
file
adjusted fill factor (RA) and the renourishment factor (RJ). The data file to import
must be in the following format. Please note that the first six lines contain header
information to be applied to the theme. The next line is the column headers. The
first six columns' headers must be exactly as shown. The rest of the column
headers are the sieve sizes used in the sample. One record (line) should follow for
every sample.
6-1
Chapter 6 Sediment Sample Analysis

 Previous Page
