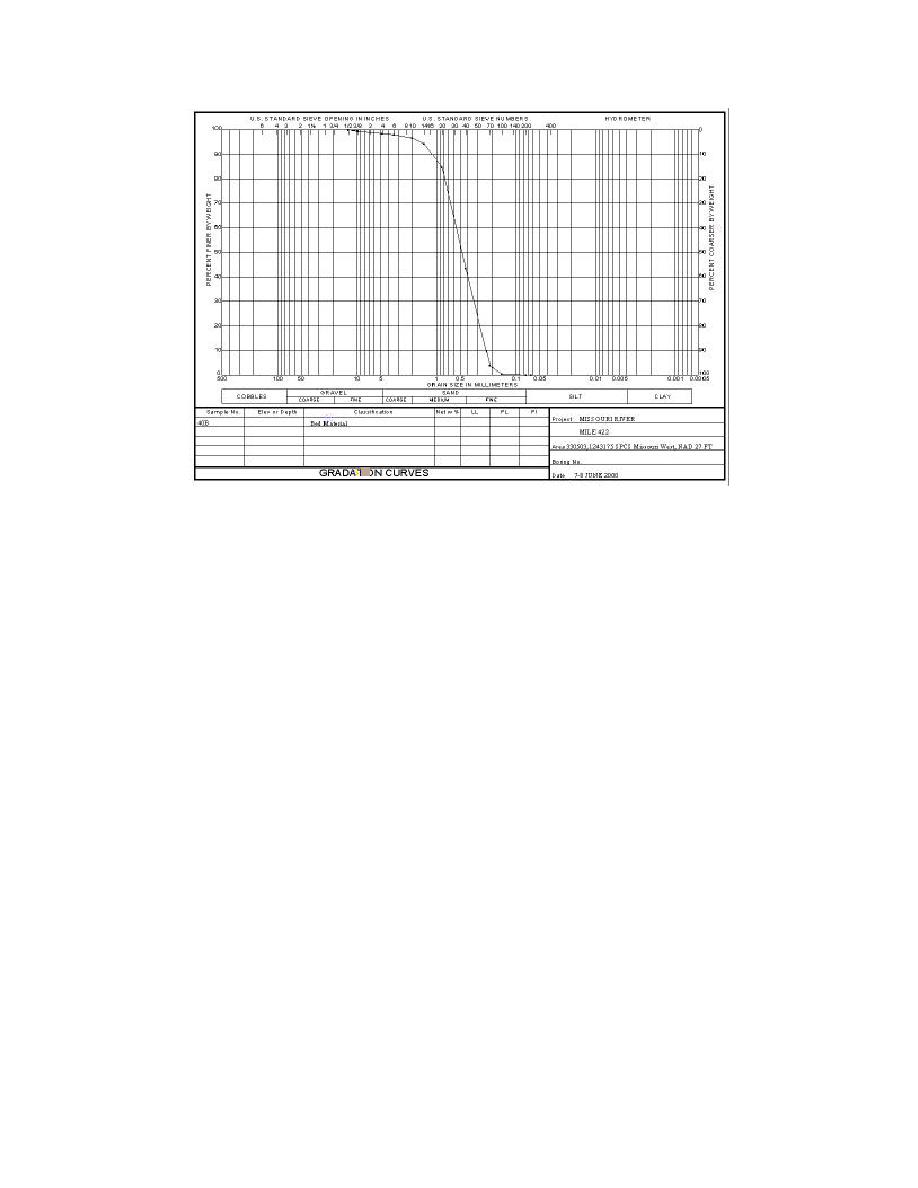
Figure 6-10. Example of gradation curve
If only one sample was plotted, all the information will be attached to the theme
and displayed only when the theme is displayed. If two or more samples were
plotted, a theme will be created for each sample. The block containing the X,Y
coordinates will be attached to the individual themes and displayed only when each
theme is displayed but the project information from the input files will be placed on
the view and be displayed at all times.
Plotting Average Differential Volume from CoulterLS
Sediment Data
To plot average differential volume from CoulterLS sediment data, have the
sediment data theme active and the sample points to be plotted selected. Click on
the Import/Plot Sediment Data button on the HyPAS menu (Figure 6-8). HyPAS
Displays the Sediment Data Options menu (Figure 6-9). Choose Plot Average
Differential Volume from CoulterLS Sample(s) .
HyPAS plots the average differential volume from the selected sample(s) and
links it with the plan view. HyPAS also opens up a tabular view of the data, which is
also linked. All three of the displays will be interconnected such that any selection in
one window will be reflected in the other two. There is not a limit to the number of
desired samples plotted at one time.
Average differential Volume plots can also be relinked later. See the previous
section, Additional Notes for Plotting PHI Sediment Data for more information.
6-6
Chapter 6 Sediment Sample Analysis


 Previous Page
